🚪 学习前导 · 先看这里再开始
🎯 学完你能干什么
- 能解释声音是物体振动 vibration产生的
- 能区分 pitch 音高(频率 Hz) vs loudness 响度(振幅)
- 能解释声音在固 / 液 / 气中传播的差异——真空不能传声
- 能背 空气中声速 ≈ 340 m/s(钢 / 水中更快)
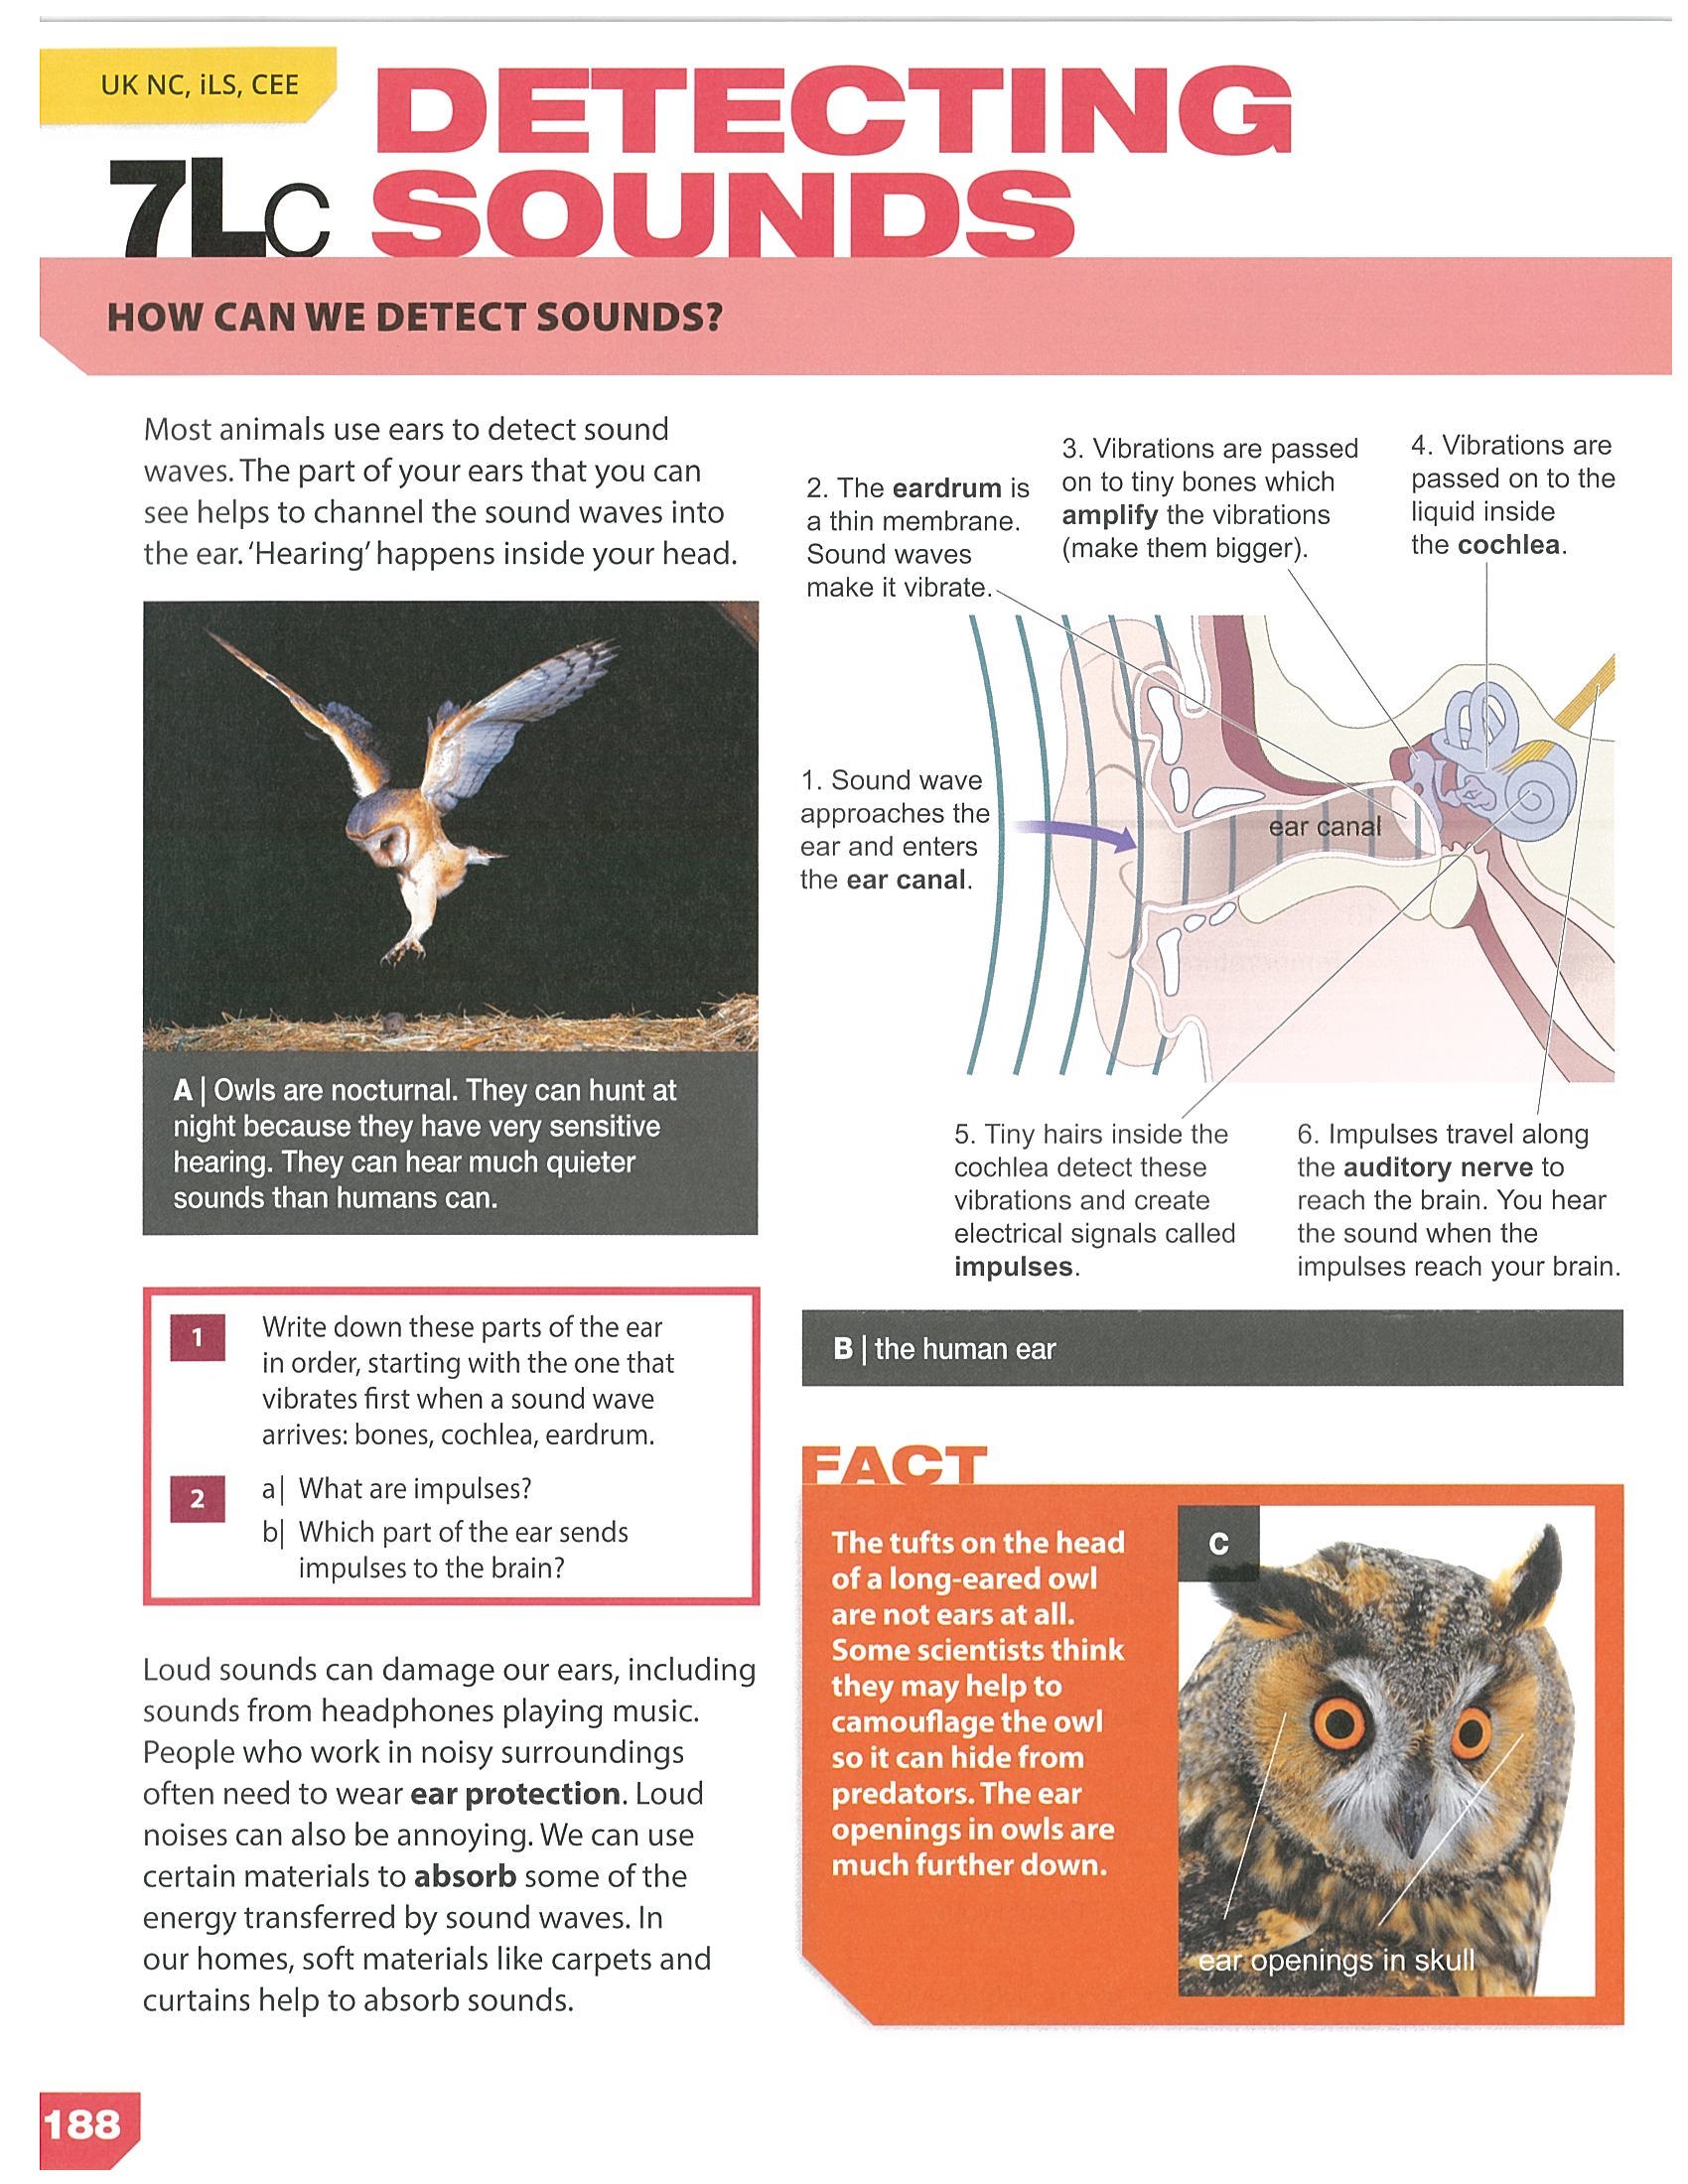
- 能解释耳朵的工作原理(耳廓 → 鼓膜 → 听小骨 → 耳蜗 → 神经)
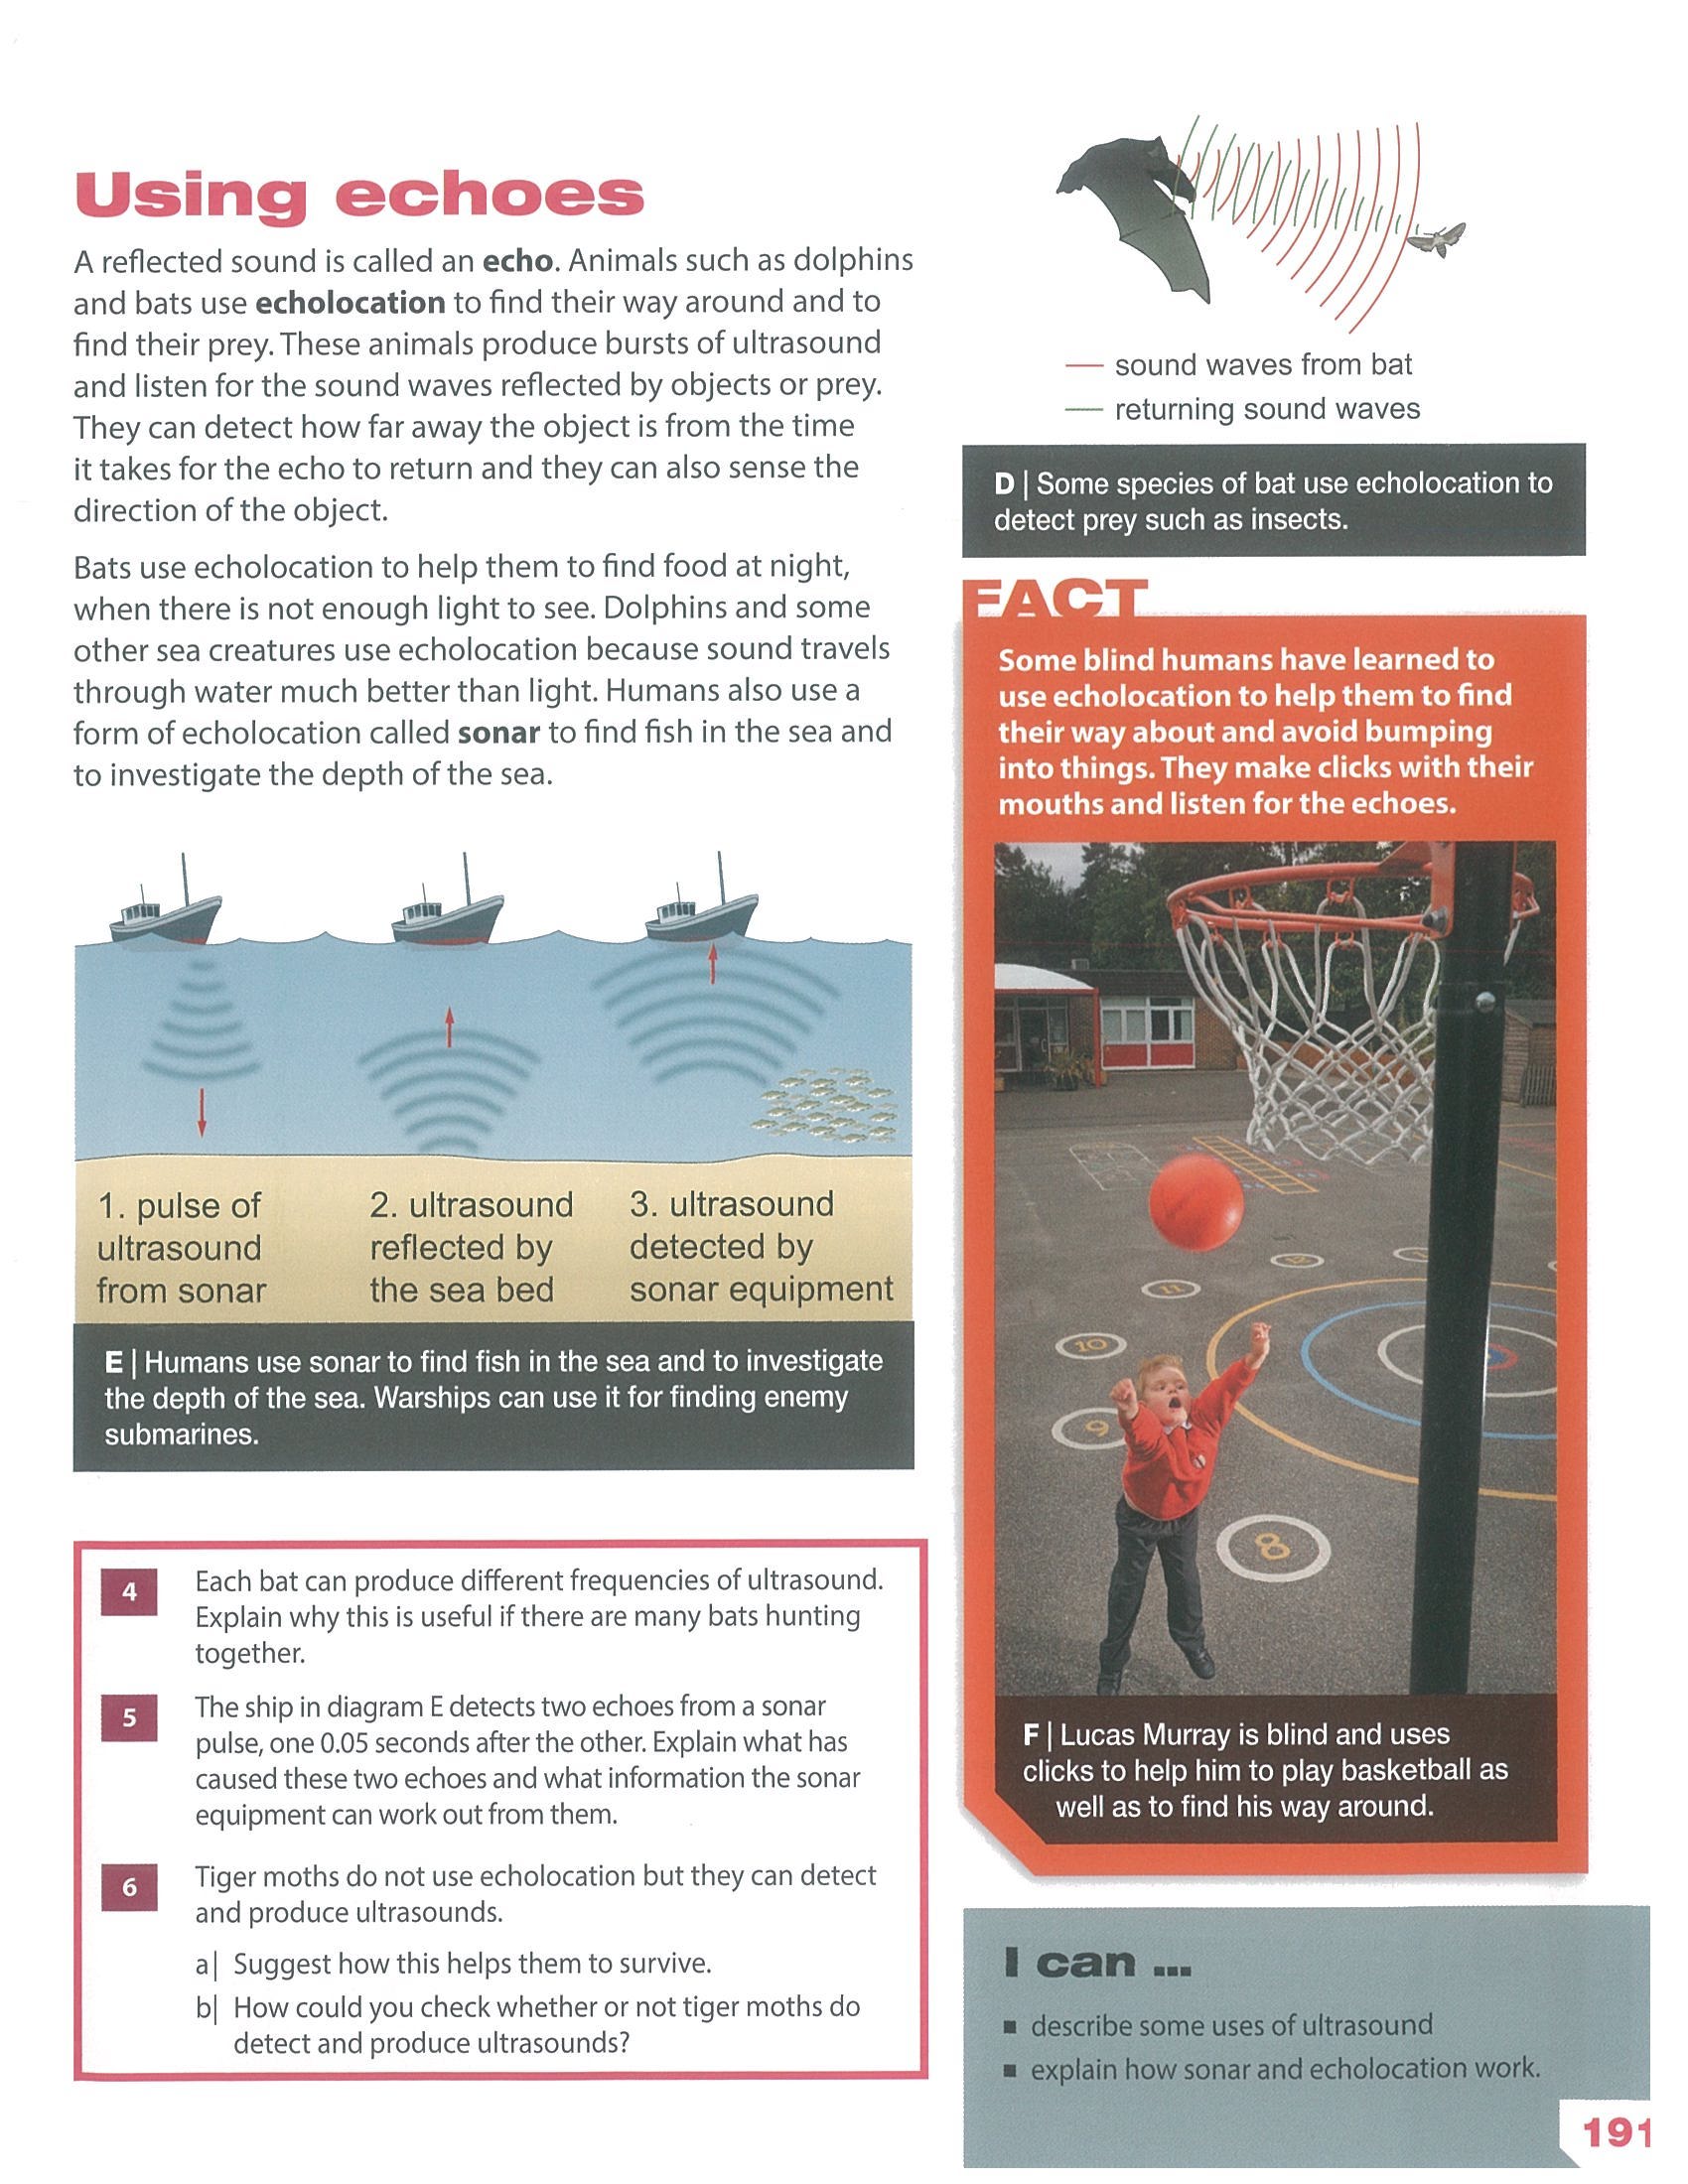
- 能用回声 echo + 速度公式算距离(声纳 sonar / 蝙蝠回声定位)
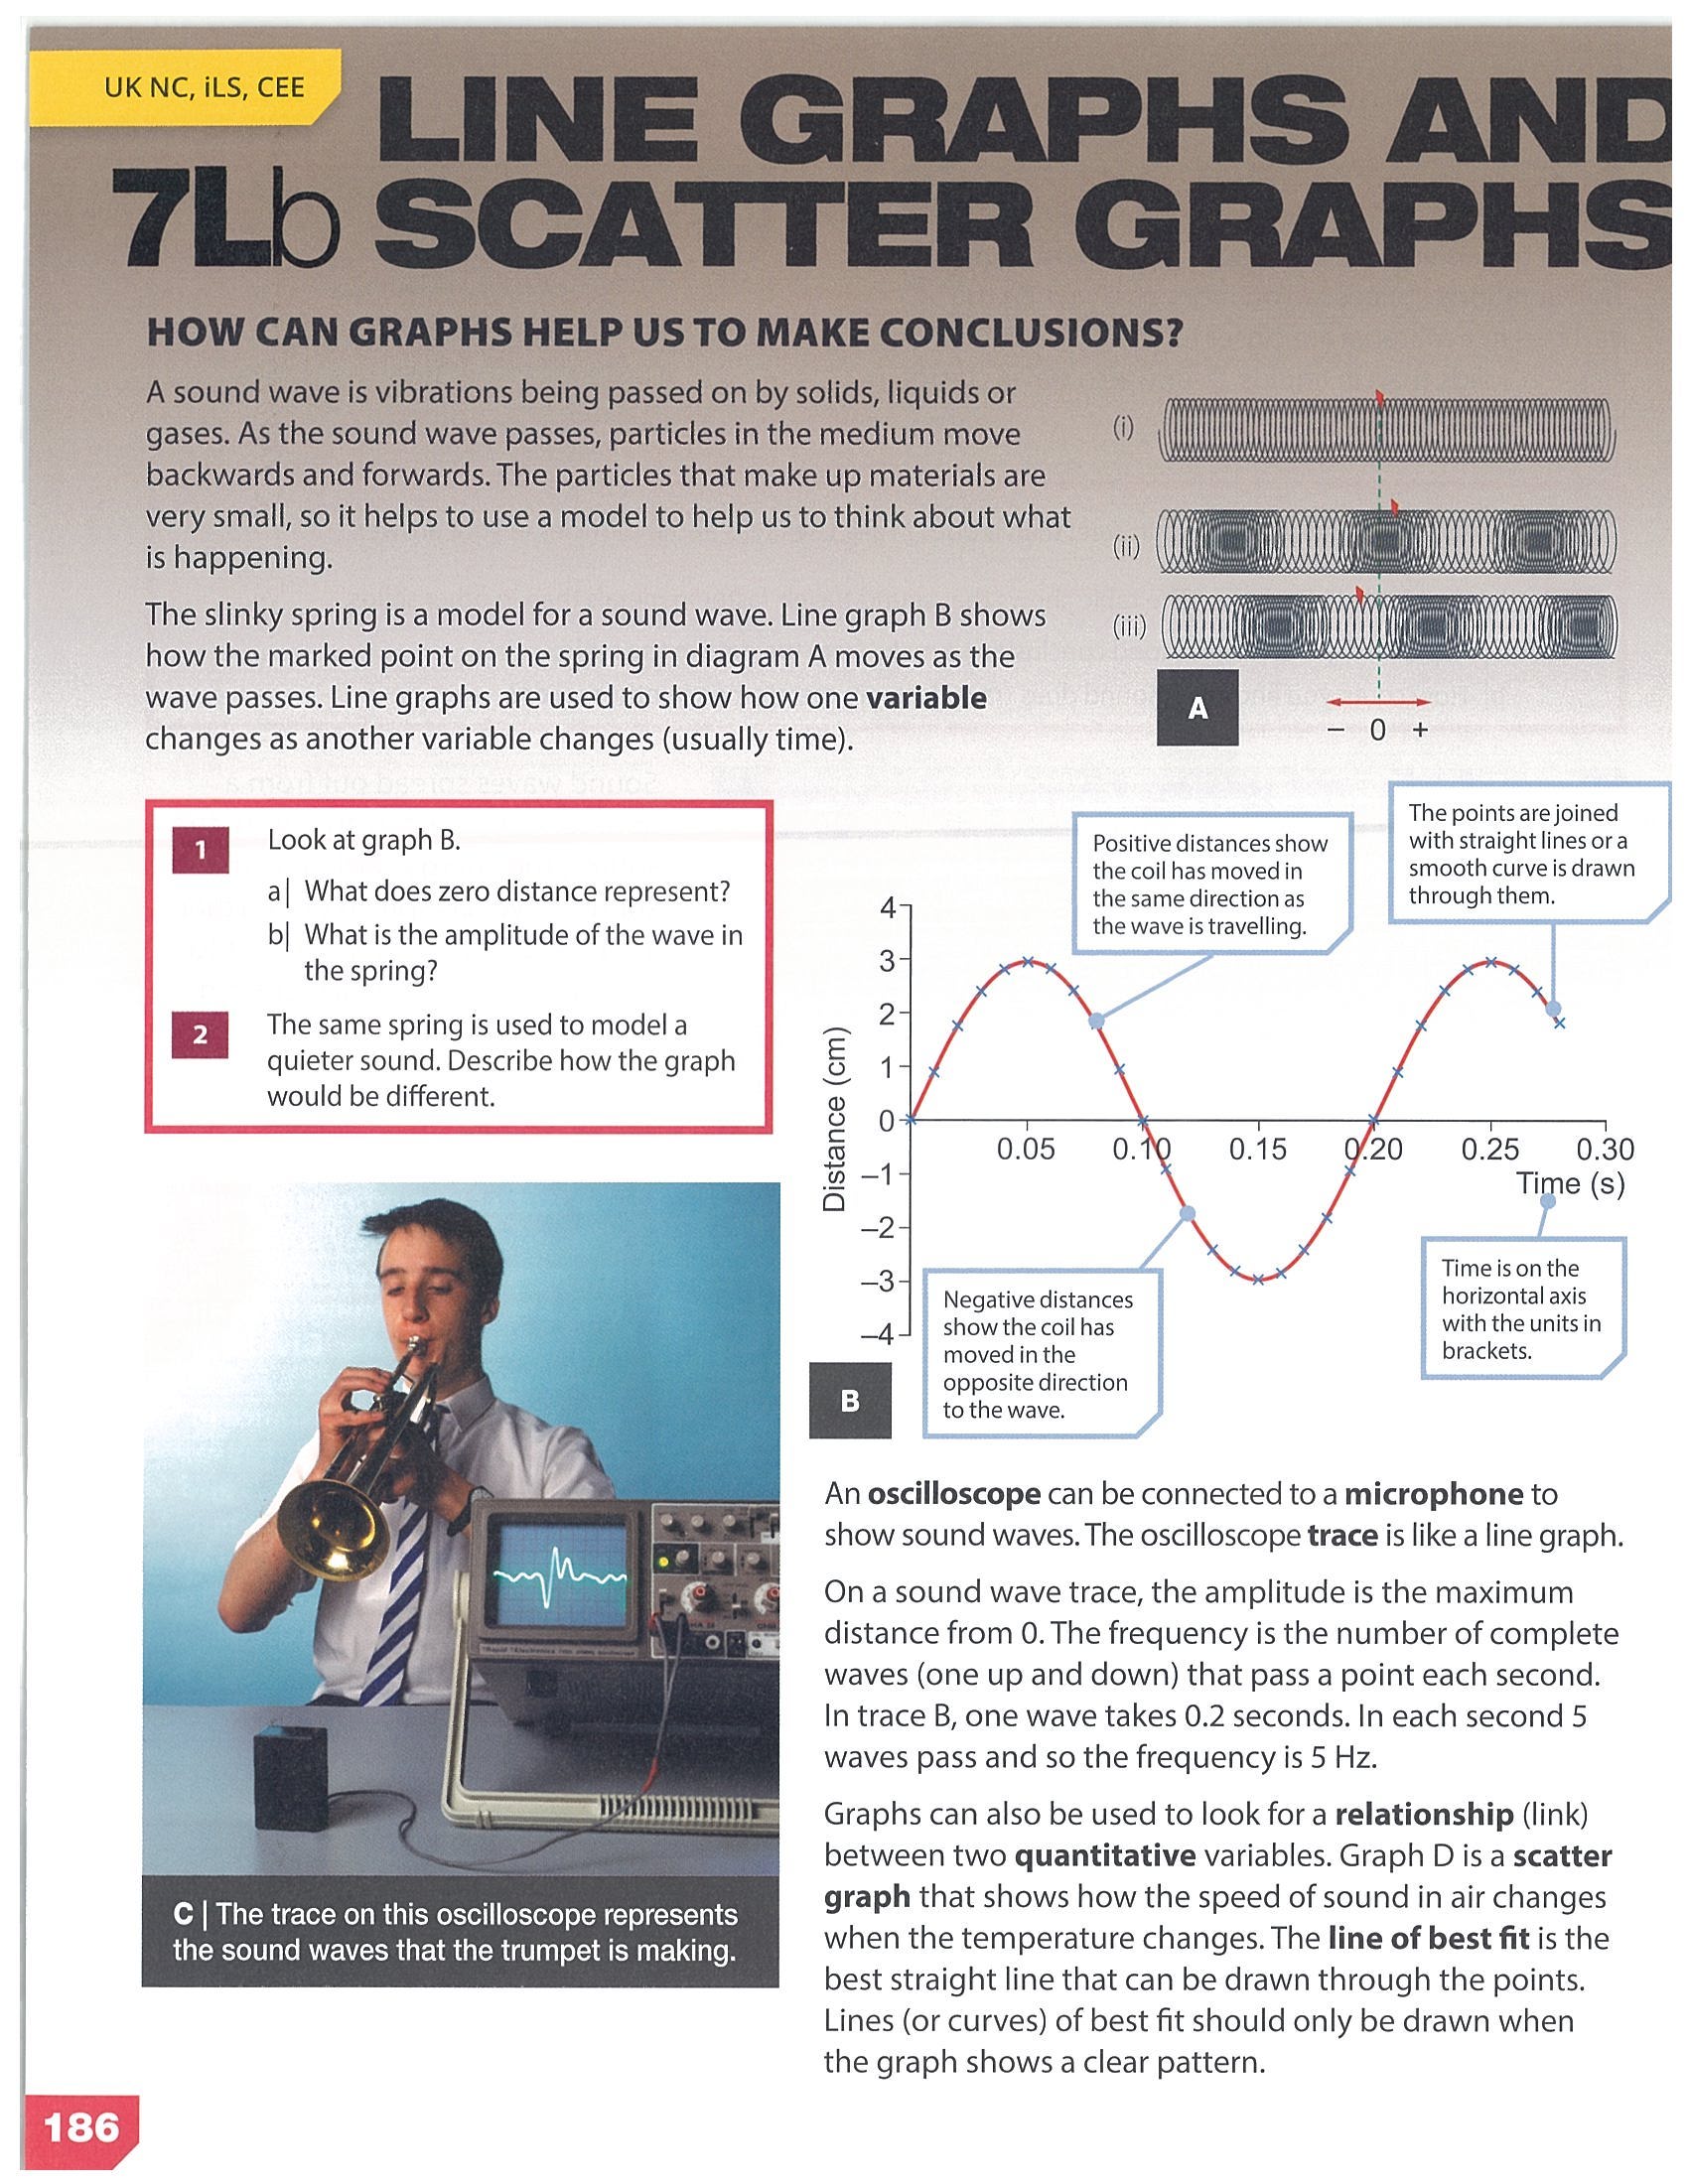
- 能读懂波形图,比较 frequency / amplitude / wavelength
- 能解释噪声污染对人和动物的危害 + 减噪方法
🛣️ 推荐学习路径
- 通读教材 16 页(不查词,速读 30 分钟)
- 跟读本视图:左边看教材图,右边看笔记(约 2.5 小时)
- 做 Workbook 7L 全部题目(约 1.5 小时)
- 专项训练:拼写卡 + 耳结构标注 + 答题规范(30 分钟)
- 挑战分级练习 L1→L2→L3(约 1 小时)
- 查漏错题本 + 自检清单(考前 30 分钟)
⚠️ 老师常考
- 必考 声音由振动产生 + 需要介质(真空不传声)
- 必考 区分 pitch(频率 Hz)vs loudness(振幅)
- 必考 比较声速:固 > 液 > 气
- 必考 回声测距:distance = speed × time ÷ 2
- 高频 耳朵 4 结构(耳廓 / 鼓膜 / 听小骨 / 耳蜗)+ 各自作用
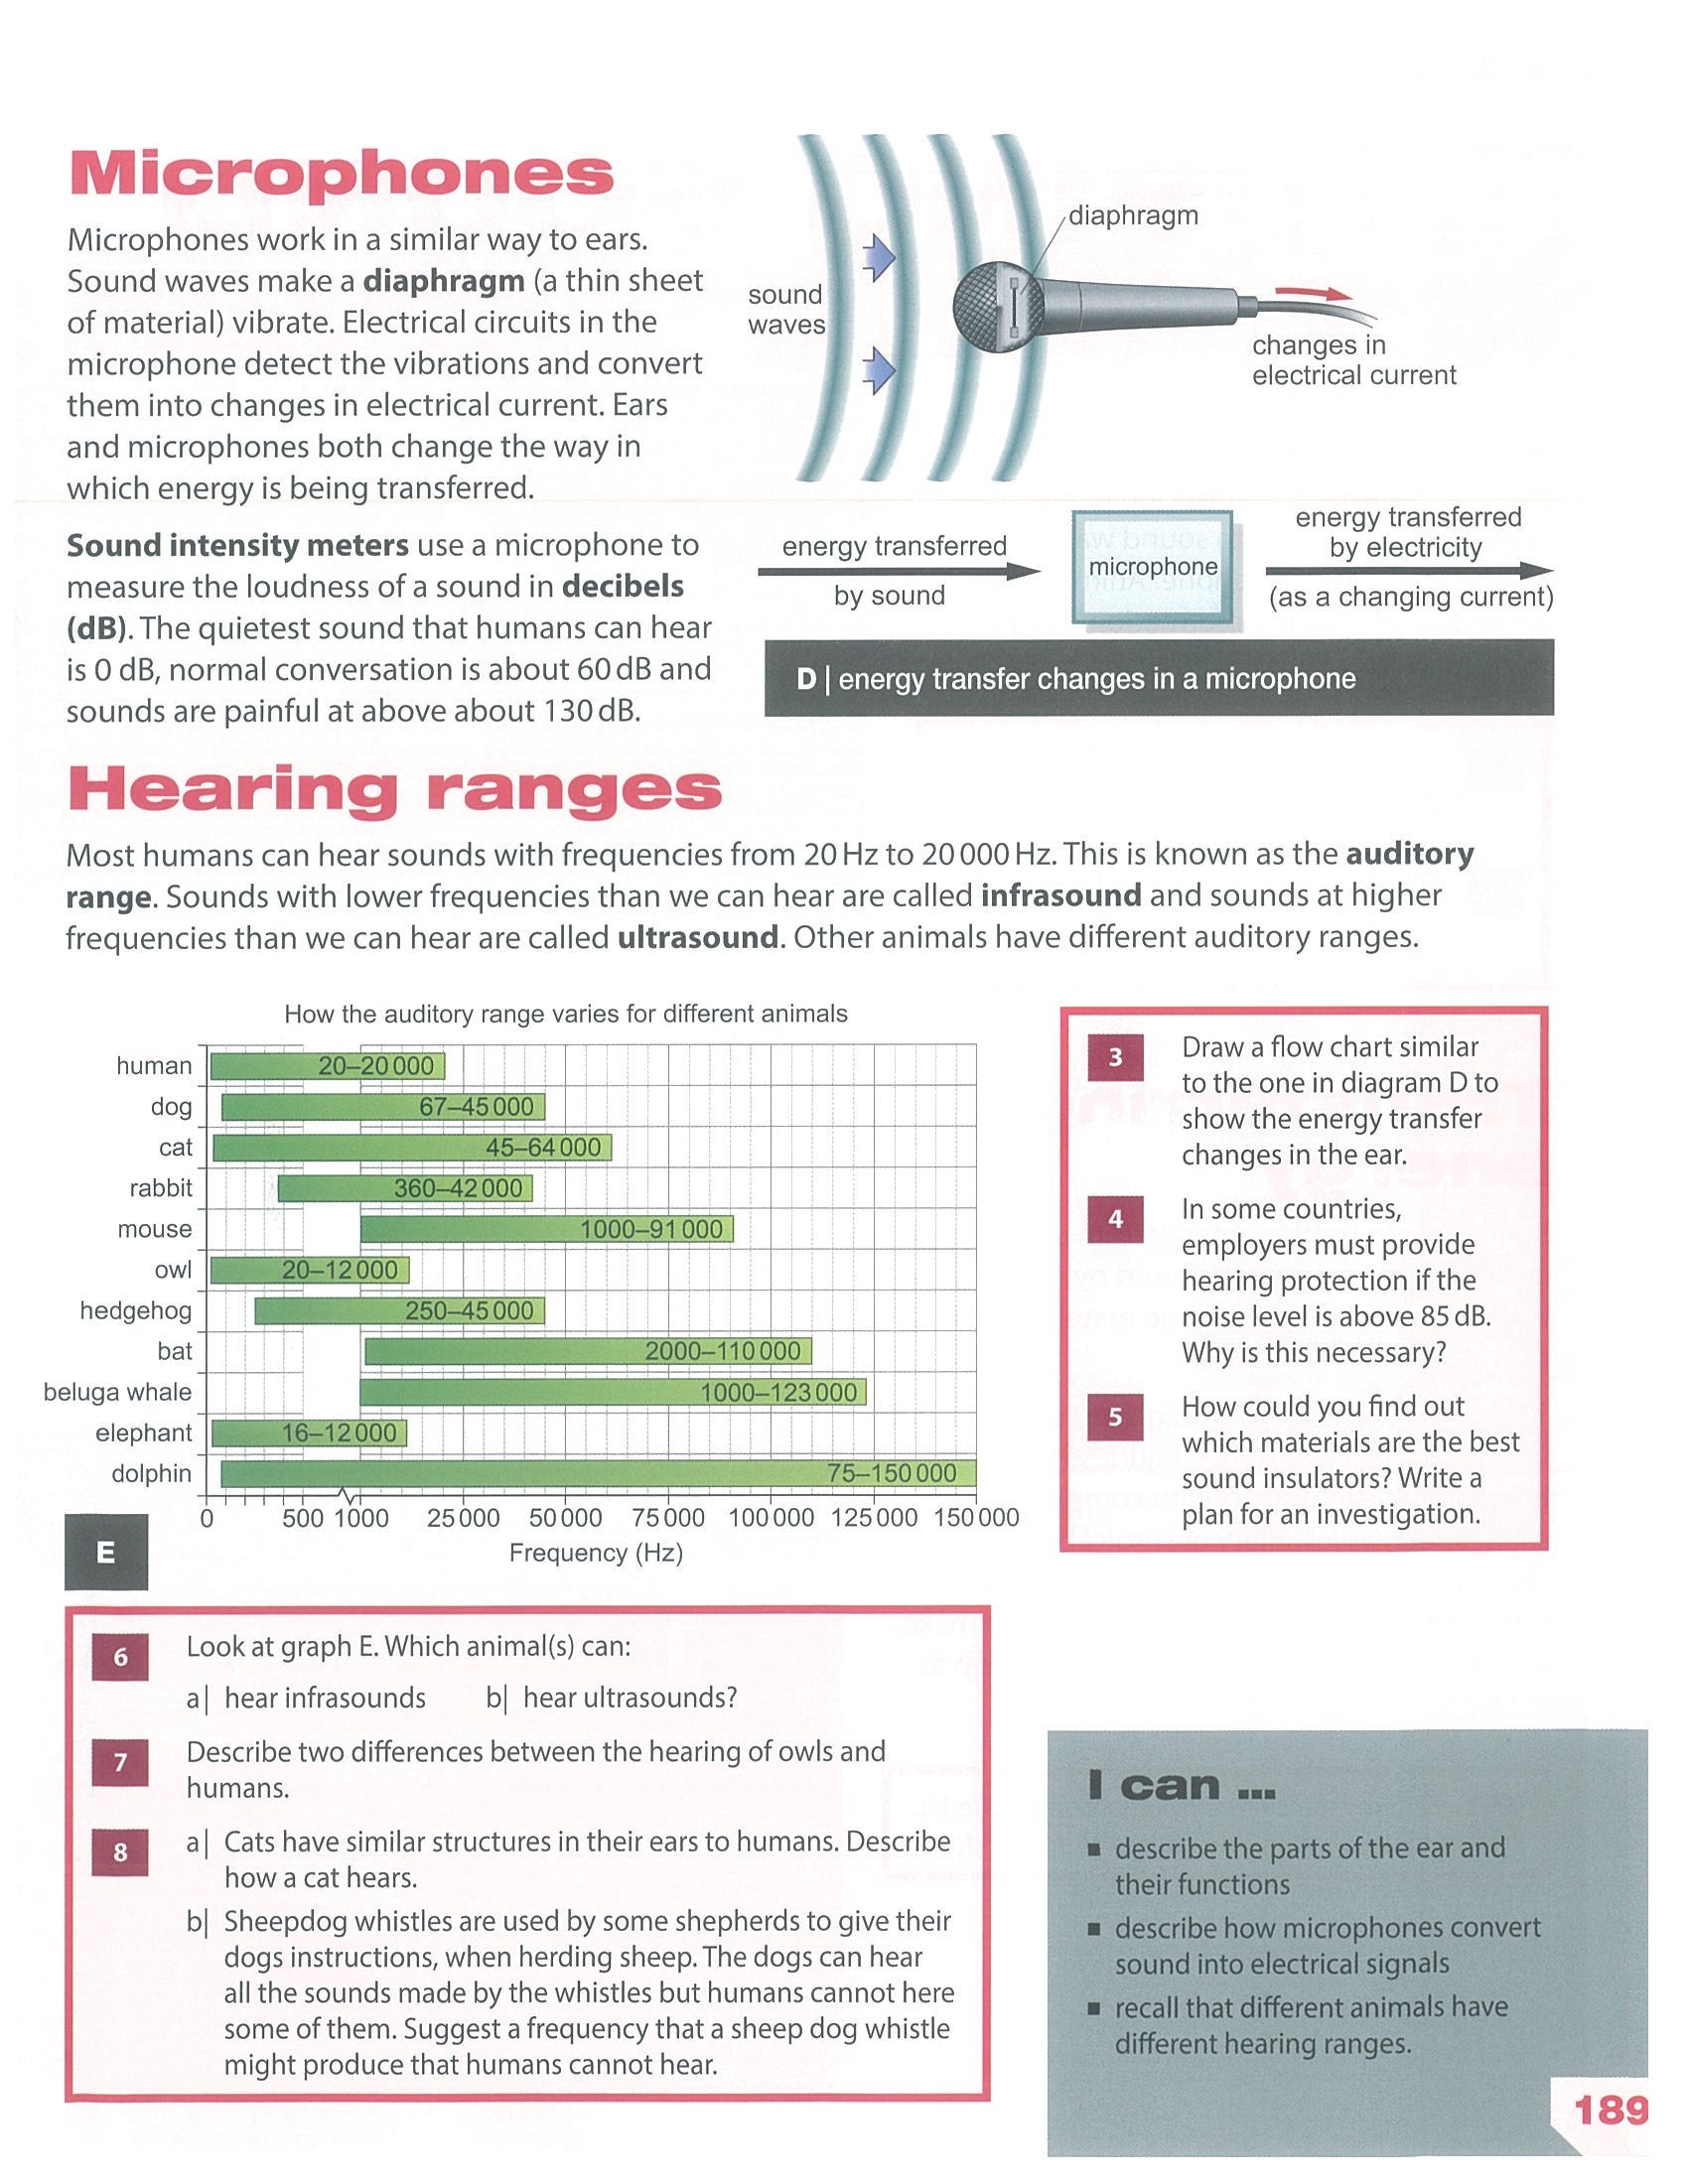
- 高频 人耳频率范围 20 Hz – 20 000 Hz;超声 ultrasound / 次声 infrasound
- 高频 读波形图:判断 pitch / loudness 高低
- 高频 噪声对人 + 对海洋动物的危害
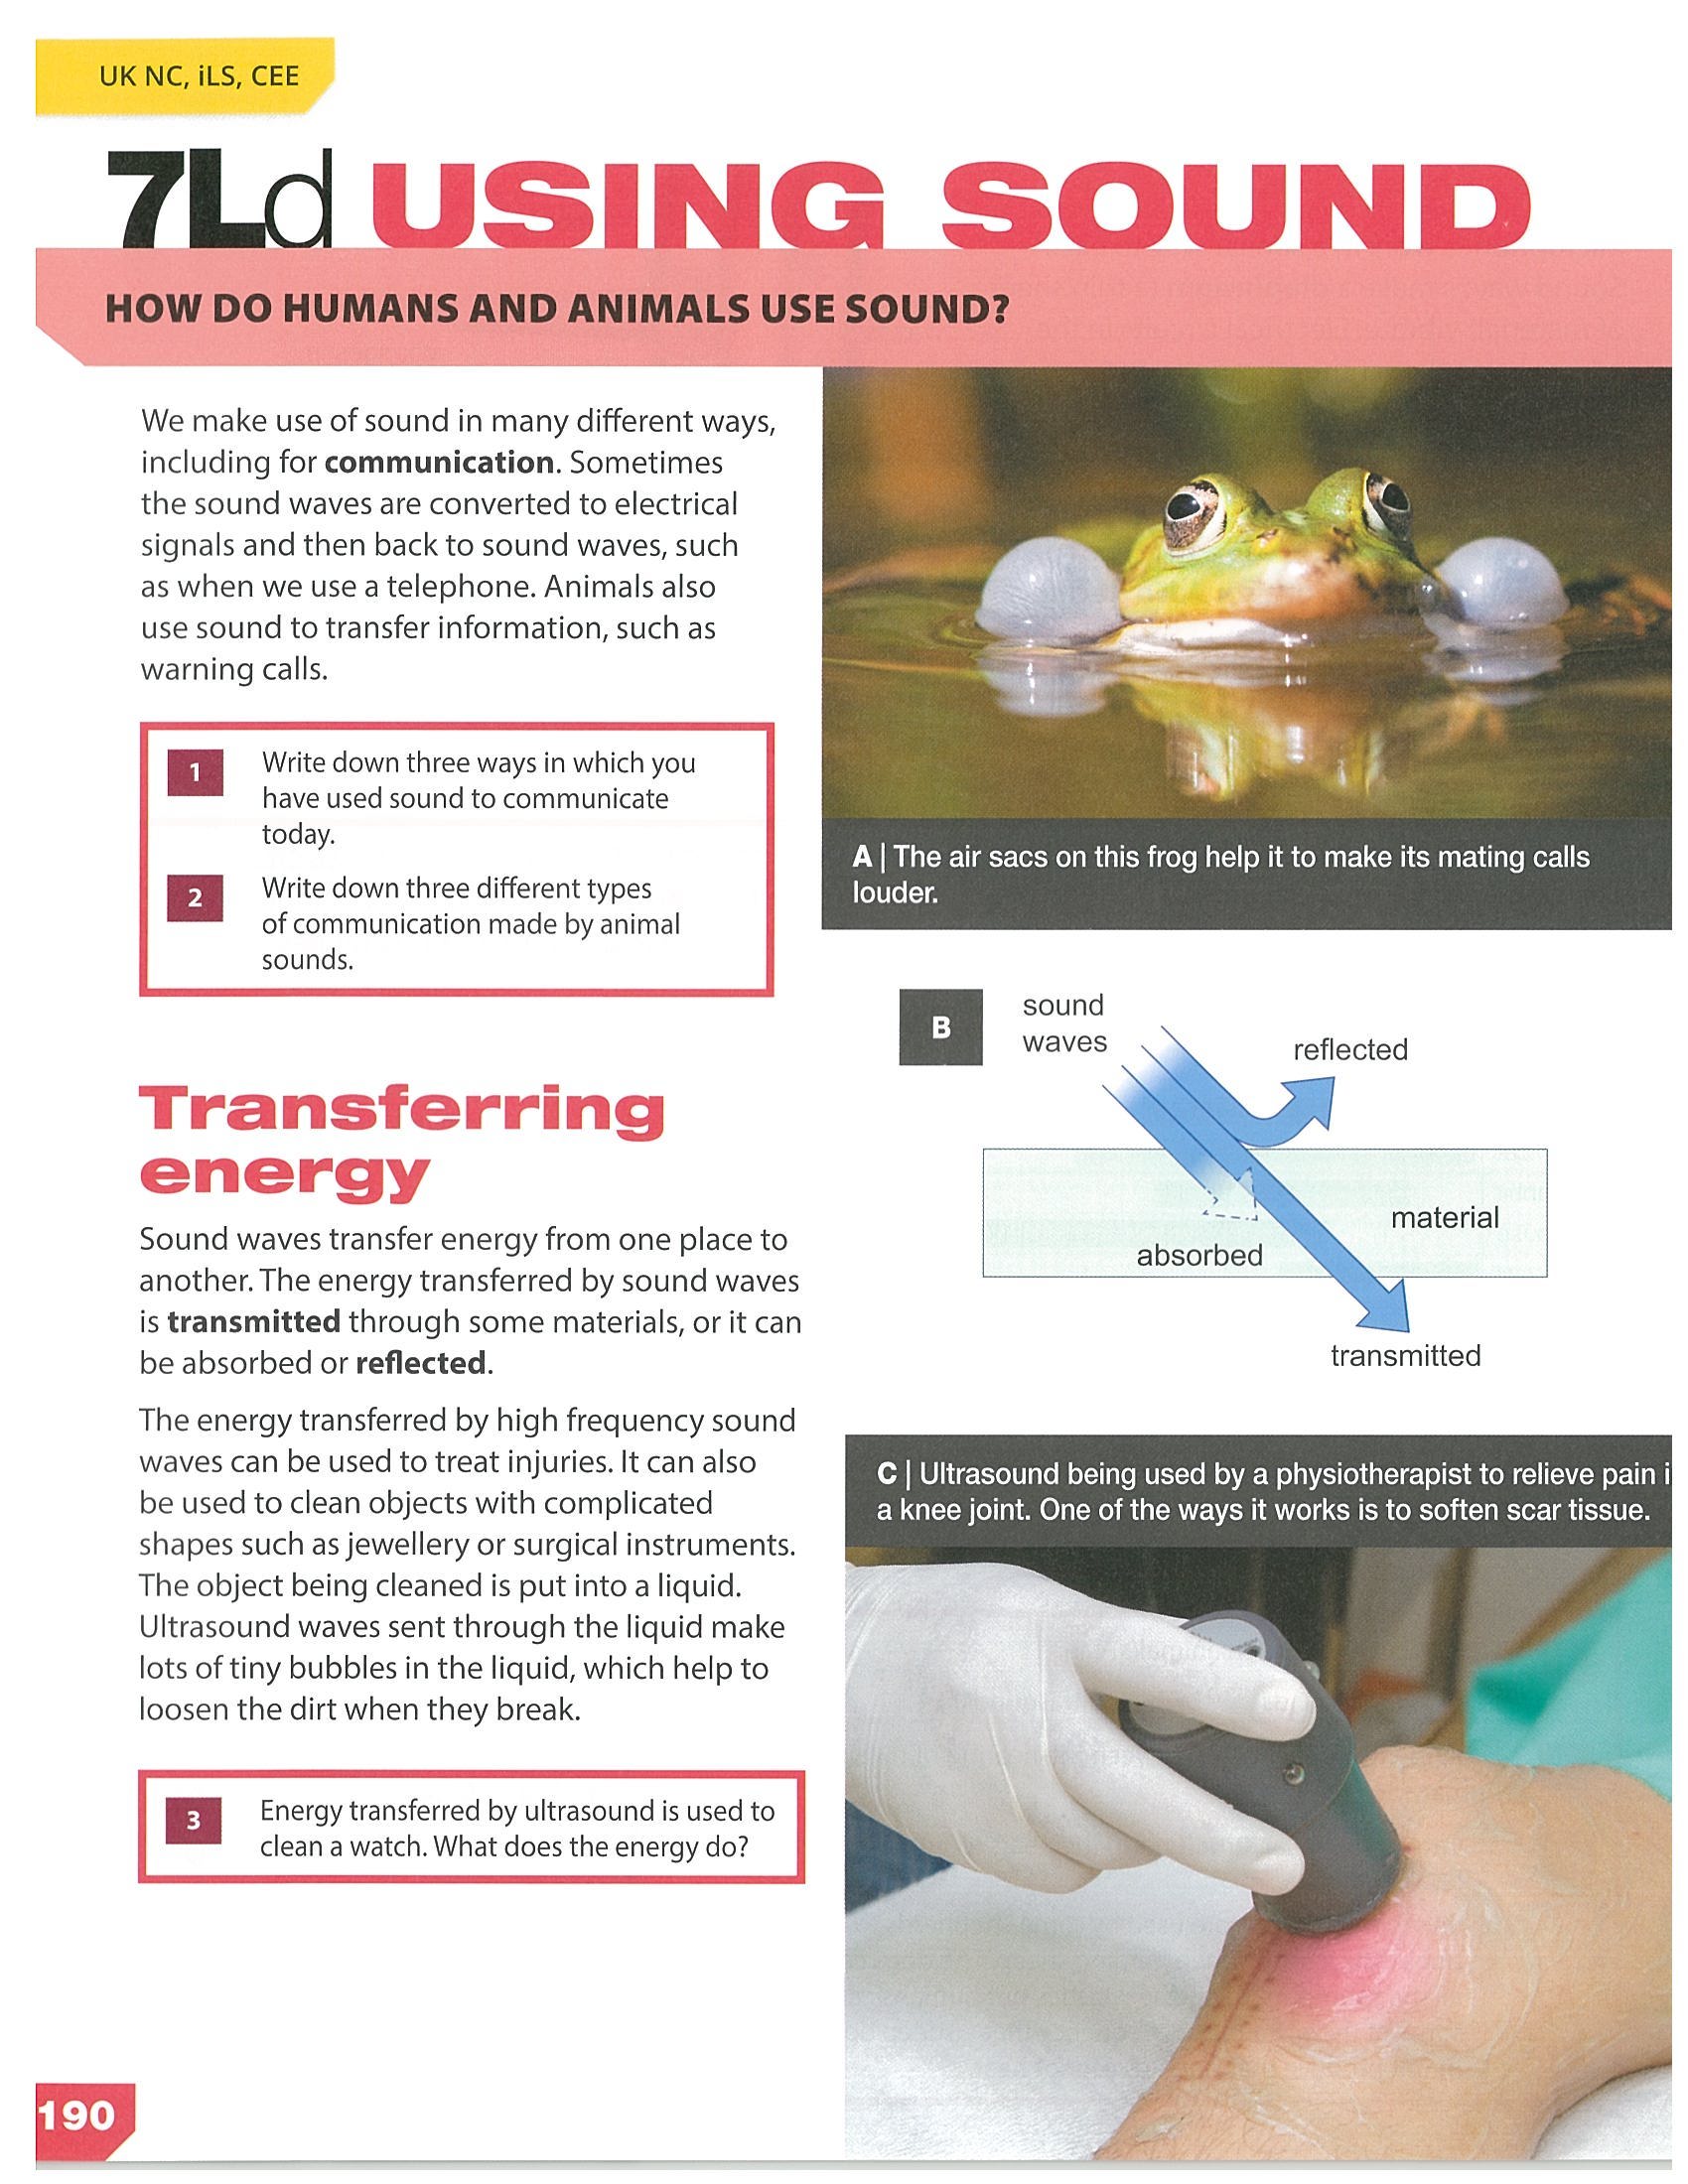
- 拓展 蝙蝠 / 海豚回声定位 echolocation;超声医学应用
🧭 前置回顾(来自 7G / 7I / 7K)
- particles 粒子(7G)—— 声音靠粒子相互推动传播(真空无粒子 → 不传声)
- states of matter 三态(7G)—— 固体粒子最紧密 → 声速最快
- kinetic energy 动能(7I)—— 声波是粒子振动的能量传递
- vibration 振动(7K)—— 弹簧 / 物体振动产生声波
- speed = distance ÷ time(数学)—— 回声测距和声速计算的核心公式
📖 教材跟读 · 左图右注
📄 教材 p.181–183
📝 学习内容
核心理解:动物声音 + 振动产生声音
1. 声音是怎么来的
所有声音都是由"某物在振动 vibration"产生的。
振动 = 来回往返的运动(back and forth)。
振动停止 → 声音消失。证明方法:
- 敲音叉 → 振动可见 / 听见 / 摸得到
- 把振动的音叉伸进水里 → 水会被振出水花
- 用手按住正在响的吉他弦 → 声音立刻停
- 对着鼓面撒米粒,敲鼓 → 米粒跳起来(鼓面在振)
2. 动物用声音干什么
| 用途 | 例子 |
|---|---|
| 交流 communicate | 狼群嚎叫 / 鸟叫呼唤 / 海豚口哨 |
| 警告 warn | 豹子咆哮 / 响尾蛇尾巴响 / 蜜獾警告 |
| 守护领地 territory | 狮子吼 / 鸟唱歌划地盘 |
| 求偶 win a mate | 青蛙鸣 / 公鹿叫 / 蟋蟀 |
| 捕猎 hunt | 蝙蝠回声定位 echolocation / 海豚定位鱼群 |
| 导航 find way | 蝙蝠 / 鲸 / 海豚靠回声 |
3. 人怎么发出声音
- 说话 / 唱歌——空气流过声带 vocal cords振动
- 拍手 / 跺脚——皮肤 / 鞋底碰撞振动空气
- 口哨——空气流过嘴唇形成振动
- 打喷嚏 / 咳嗽——气流冲过声带快速振动
4. 乐器怎么发声(必懂!)
| 乐器 | 什么在振动 |
|---|---|
| 吉他 / 小提琴 / 钢琴 | 弦 string 振动 |
| 鼓 / 锣 / 钹 | 面 / 膜 membrane 振动 |
| 笛子 / 长笛 / 萨克斯 | 管内空气柱 air column 振动 |
| 三角铁 / 木琴 | 金属 / 木块 振动 |
| 喇叭 / 扬声器 | 纸盆 / 振膜 振动 |
5. 频率 Frequency 和 音高 Pitch
频率 frequency = 每秒振动多少次
单位:赫兹 hertz (Hz)
1 Hz = 每秒振动 1 次
频率决定音高(pitch):
- 频率高 → 音高高(尖、细——如鸟叫、女声)
- 频率低 → 音高低(沉、闷——如鼓声、男声)
📌 不是响度!响度由振幅决定(下一节)。
6. 动物的频率范围(必背!)
| 动物 | 能听到的范围(Hz) |
|---|---|
| 人类 | 20 – 20 000 |
| 狗 | 40 – 60 000(所以狗哨人听不到) |
| 猫 | 55 – 79 000 |
| 蝙蝠 | 2 000 – 110 000(用超声捕猎) |
| 海豚 | 75 – 150 000 |
| 大象 | 16 – 12 000(能听低频次声,预警地震 / 海啸) |
- Ultrasound 超声:> 20 000 Hz(人耳听不到,蝙蝠 / 狗 / 海豚 / 医学超声)
- Infrasound 次声:< 20 Hz(人耳也听不到,大象 / 鲸 / 地震波)
为什么"真空中振铃"实验里铃就听不见了?
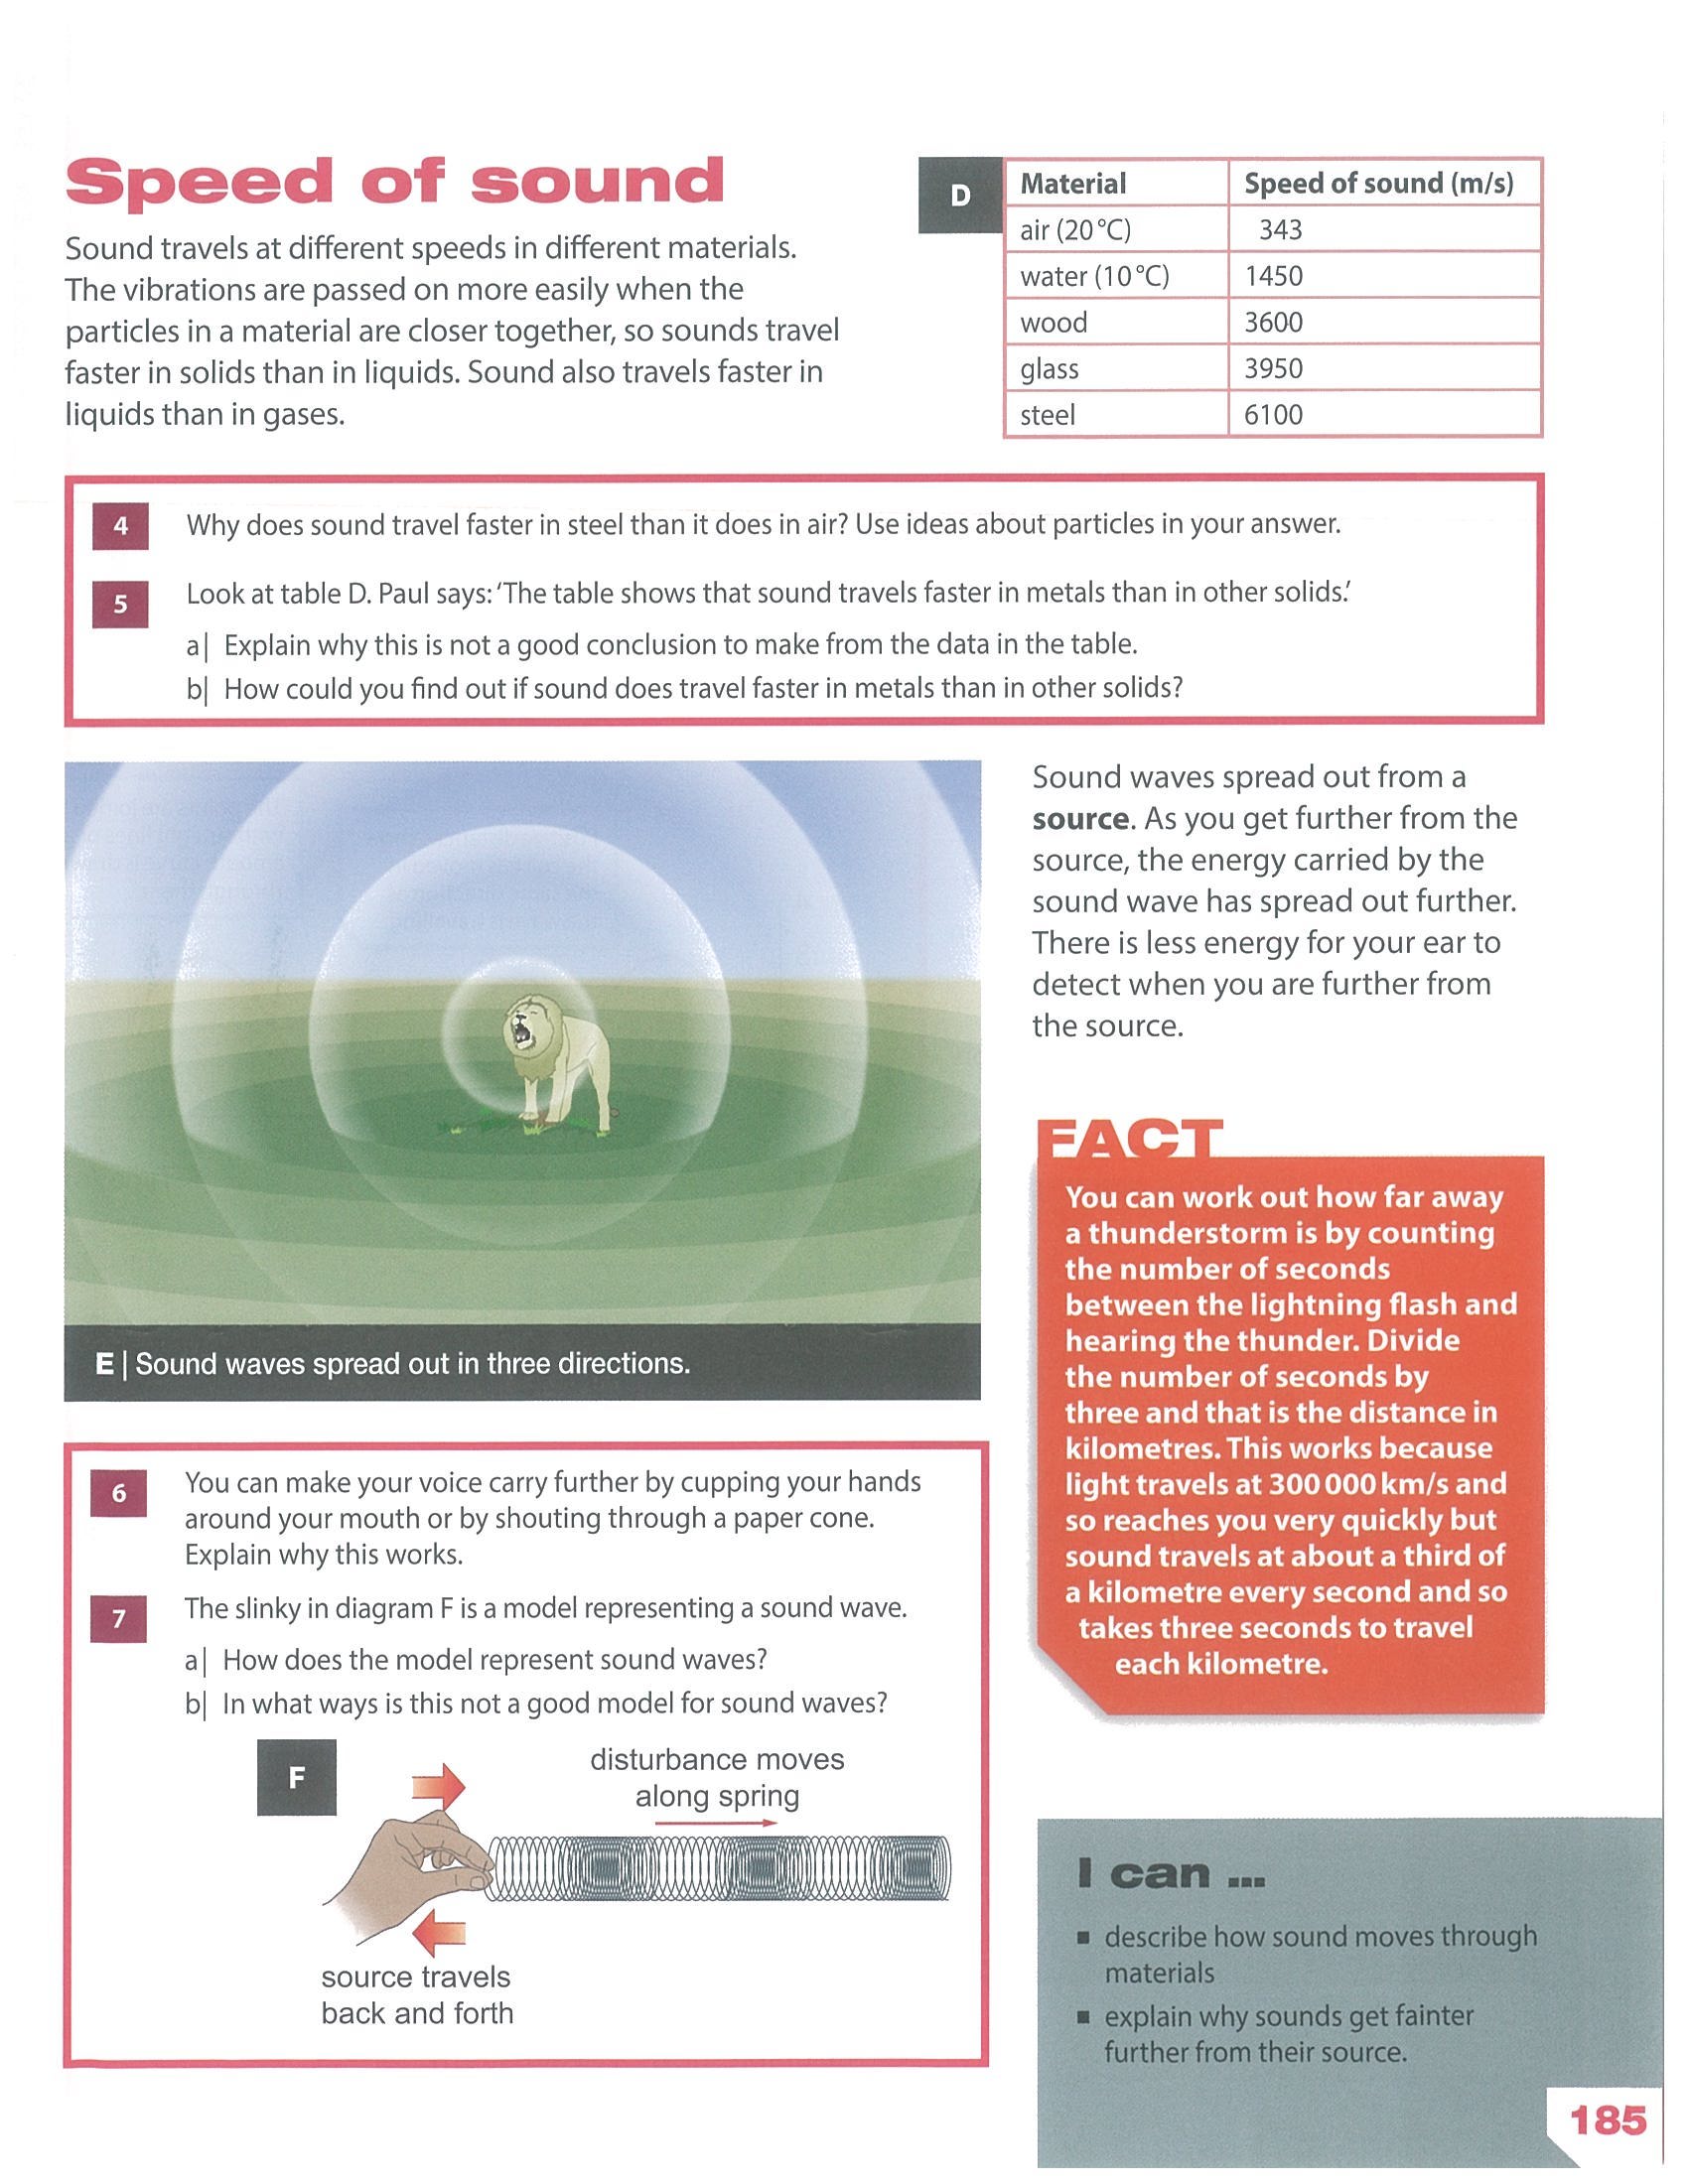
💡 声音的传播需要介质(medium)——空气 / 水 / 固体里的粒子。把空气抽走 → 没有粒子来"传递振动" → 即使铃在振,振动也传不到耳朵。
对比光:光是电磁波,不需要介质,所以你能看到真空中的铃在振。这是"光能在真空中传,声音不能"的经典证据。
对比光:光是电磁波,不需要介质,所以你能看到真空中的铃在振。这是"光能在真空中传,声音不能"的经典证据。
⚠️ 高频题:解释"sound is made by..."必答 vibration / something vibrating;列 3 种动物使用声音的目的;区分超声 / 次声 / 人耳范围。
✅ 学完小检查(3 题)
1. 我能解释所有声音都来自振动,并举 3 个证明例子
2. 我能列出动物用声音的 5 种目的
3. 我能背 5 种动物各自的 Hz 范围 + 区分 ultrasound / infrasound
💡 句子级中英对照。
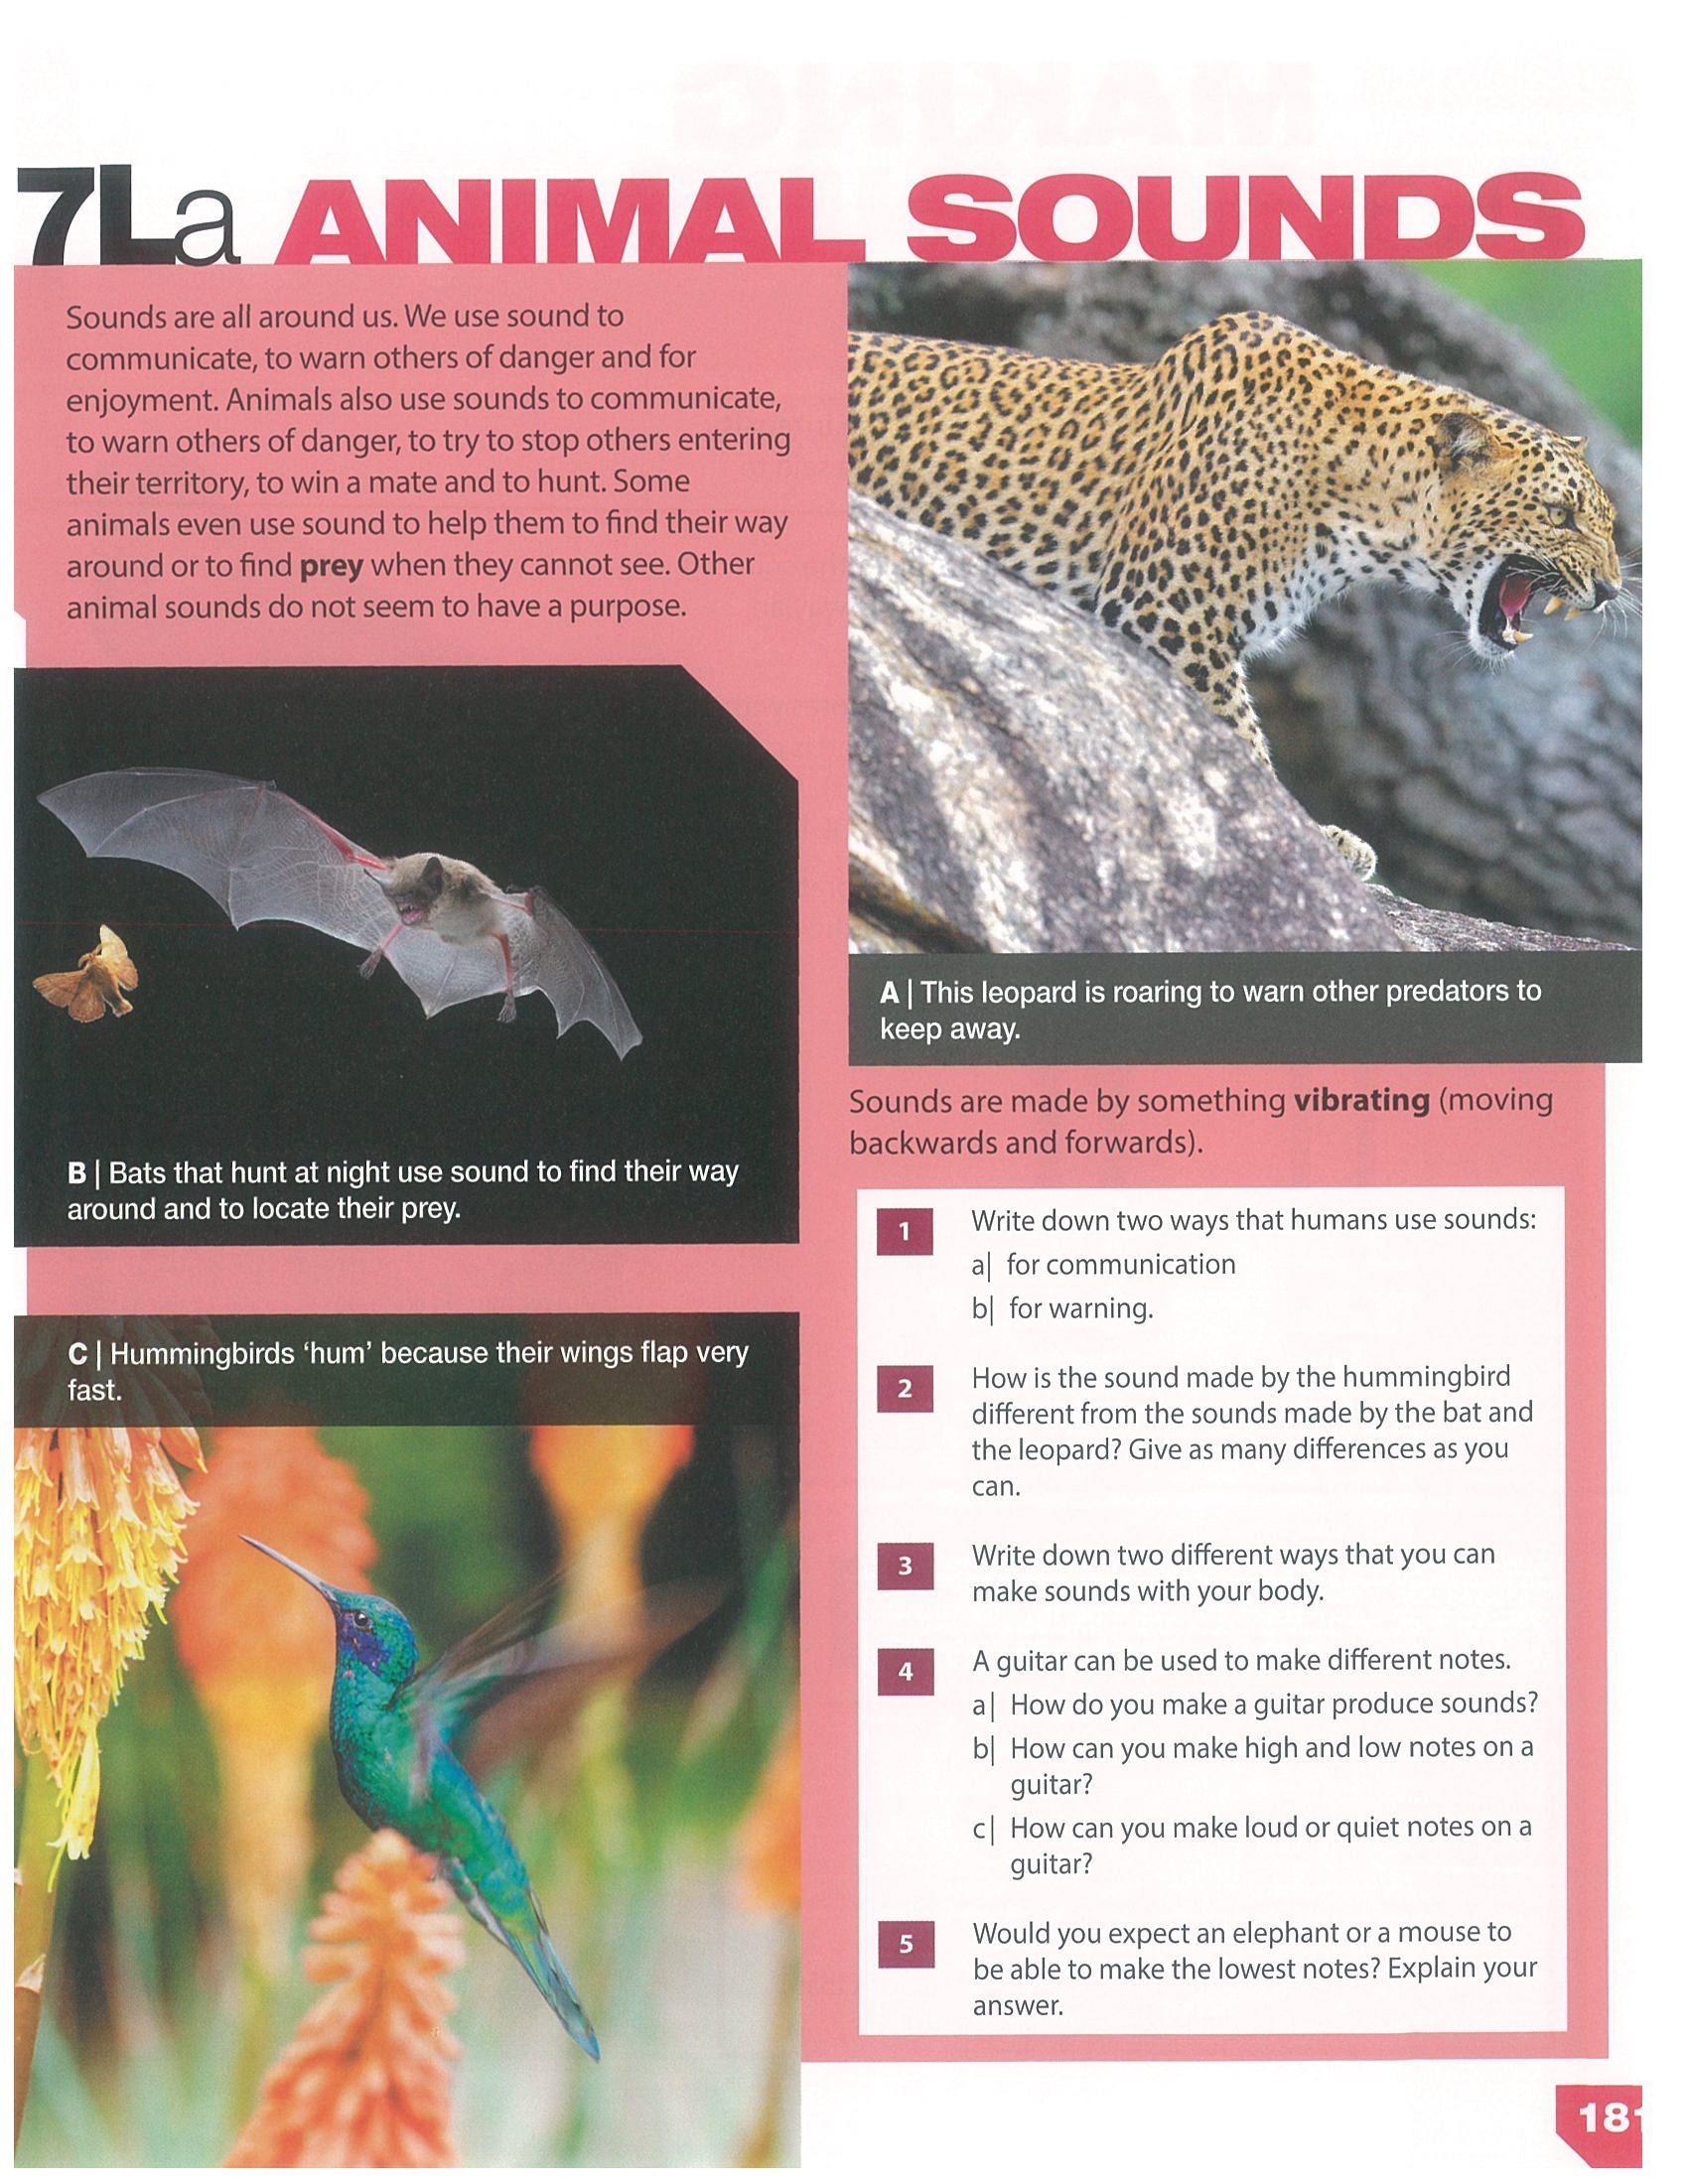
📄 教材 p.181 · 7La Animal Sounds
Sounds are all around us.
声音在我们周围无处不在。
We use sound to communicate, to warn others of danger and for enjoyment.
我们用声音来交流、警告别人有危险,也用声音来娱乐。
Animals also use sounds to communicate, to warn others of danger, to try to stop others entering their territory, to win a mate and to hunt.
动物也用声音来交流、警告其他动物有危险、试图阻止其他动物进入自己的领地、吸引配偶以及捕猎。
Some animals even use sound to help them to find their way around or to find prey when they cannot see.
有些动物甚至在看不见时用声音帮助自己辨别方向或寻找猎物。
Other animal sounds do not seem to have a purpose.
其他一些动物声音似乎没有明确目的。
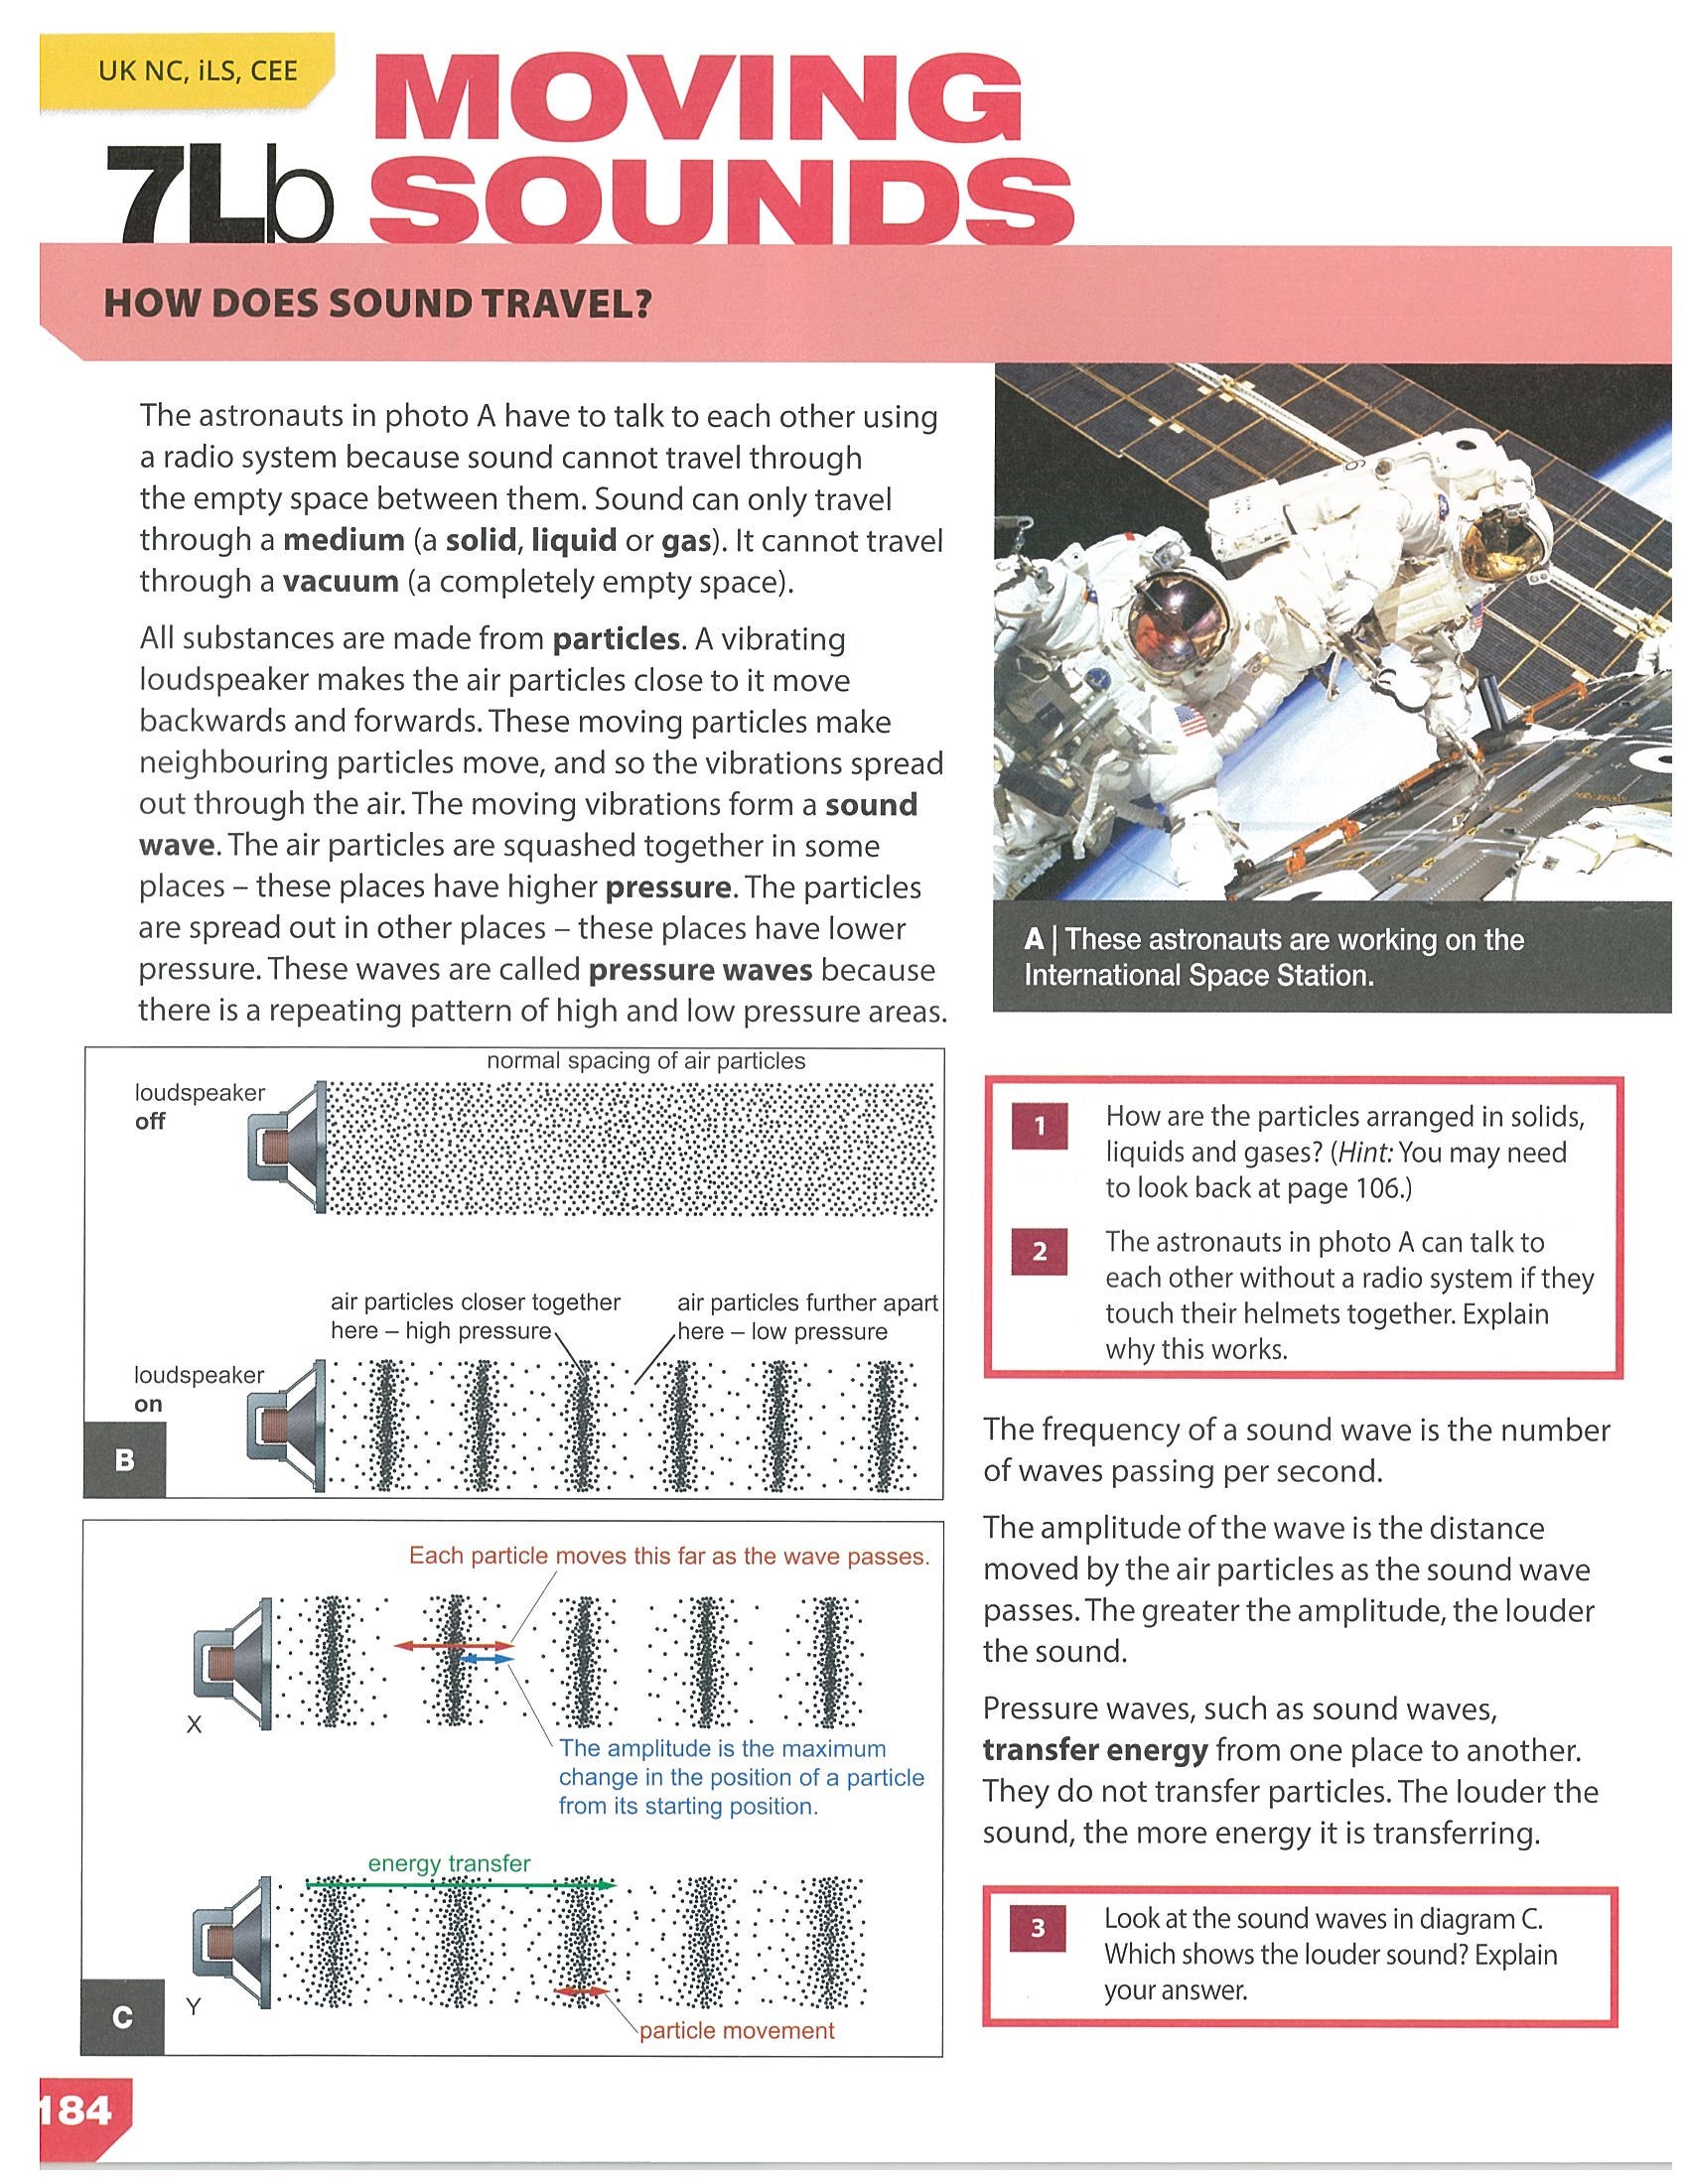
Sounds are made by something vibrating, moving backwards and forwards.
声音是由某物振动产生的,也就是来回运动产生的。
This leopard is roaring to warn other predators to keep away.
这只豹子正在咆哮,警告其他捕食者离远一点。
Bats that hunt at night use sound to find their way around and to locate their prey.
夜间捕猎的蝙蝠用声音辨别方向并定位猎物。
Hummingbirds "hum" because their wings flap very fast.
蜂鸟会发出“嗡嗡”声,因为它们的翅膀拍动得非常快。
Write down two ways that humans use sounds for communication.
写出人类使用声音进行交流的两种方式。
Write down two ways that humans use sounds for warning.
写出人类使用声音进行警告的两种方式。
How is the sound made by the hummingbird different from the sounds made by the bat and the leopard?
蜂鸟发出的声音与蝙蝠和豹子发出的声音有什么不同?
Give as many differences as you can.
尽可能多地写出差异。
Write down two different ways that you can make sounds with your body.
写出你可以用身体发出声音的两种不同方式。
A guitar can be used to make different notes.
吉他可以用来发出不同音符。
How do you make a guitar produce sounds?
你怎样让吉他发出声音?
How can you make high and low notes on a guitar?
你怎样在吉他上发出高音和低音?
How can you make loud or quiet notes on a guitar?
你怎样在吉他上发出响亮或安静的音符?
Would you expect an elephant or a mouse to be able to make the lowest notes?
你认为大象还是老鼠能够发出最低的音?
Explain your answer.
解释你的答案。
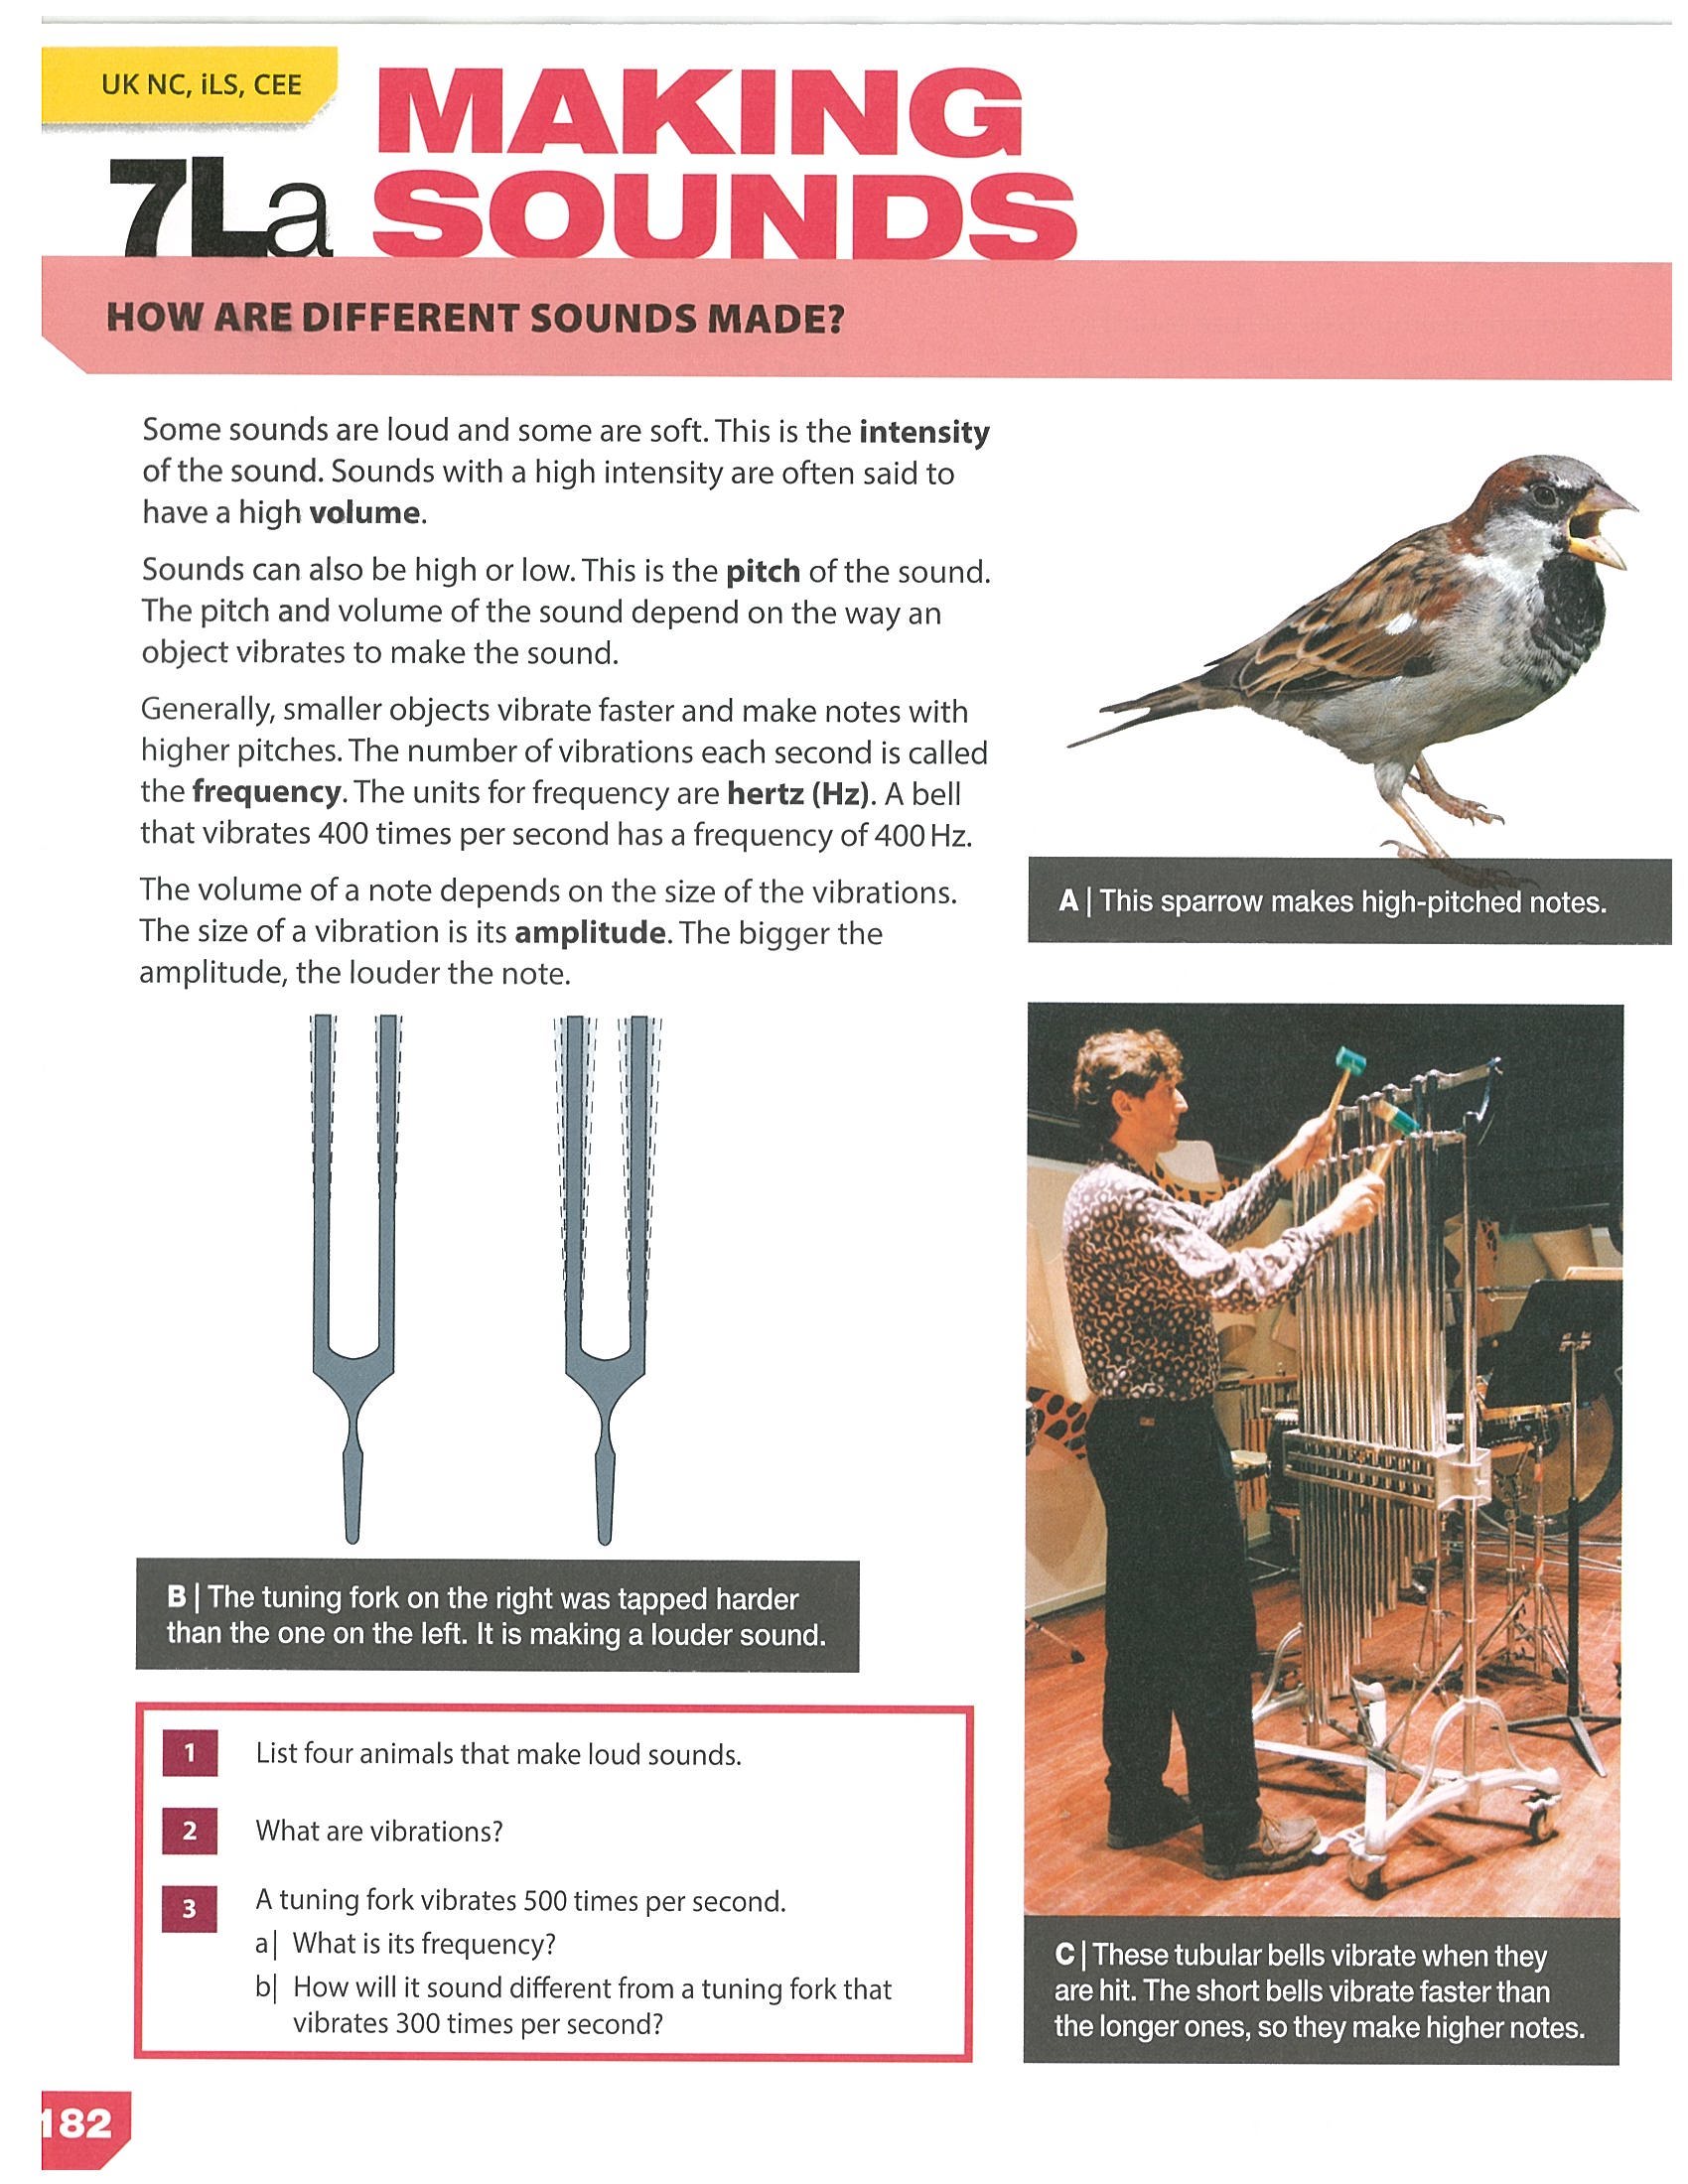
📄 教材 p.182 · 7La Making Sounds
Some sounds are loud and some are soft.
有些声音很响,有些声音很轻。
This is the intensity of the sound.
这就是声音的强度。
Sounds with a high intensity are often said to have a high volume.
强度高的声音通常被说成音量高。
Sounds can also be high or low.
声音也可以高或低。
This is the pitch of the sound.
这就是声音的音高。
The pitch and volume of the sound depend on the way an object vibrates to make the sound.
声音的音高和音量取决于物体振动产生声音的方式。
Generally, smaller objects vibrate faster and make notes with higher pitches.
一般来说,较小的物体振动更快,会发出音高更高的音。
The number of vibrations each second is called the frequency.
每秒振动的次数叫作频率。
The units for frequency are hertz (Hz).
频率的单位是赫兹(Hz)。
A bell that vibrates 400 times per second has a frequency of 400 Hz.
一个每秒振动 400 次的铃,频率为 400 Hz。
The volume of a note depends on the size of the vibrations.
一个音的音量取决于振动的大小。
The size of a vibration is its amplitude.
振动的大小就是振幅。
The bigger the amplitude, the louder the note.
振幅越大,音就越响。
This sparrow makes high-pitched notes.
这只麻雀发出高音。
The tuning fork on the right was tapped harder than the one on the left.
右边的音叉比左边的音叉被敲得更用力。
It is making a louder sound.
它正在发出更响的声音。
These tubular bells vibrate when they are hit.
这些管钟被敲击时会振动。
The short bells vibrate faster than the longer ones, so they make higher notes.
短管钟比长管钟振动更快,所以它们发出更高的音。
List four animals that make loud sounds.
列出四种会发出响亮声音的动物。
What are vibrations?
什么是振动?
A tuning fork vibrates 500 times per second.
一个音叉每秒振动 500 次。
What is its frequency?
它的频率是多少?
How will it sound different from a tuning fork that vibrates 300 times per second?
它和每秒振动 300 次的音叉相比,声音会有什么不同?
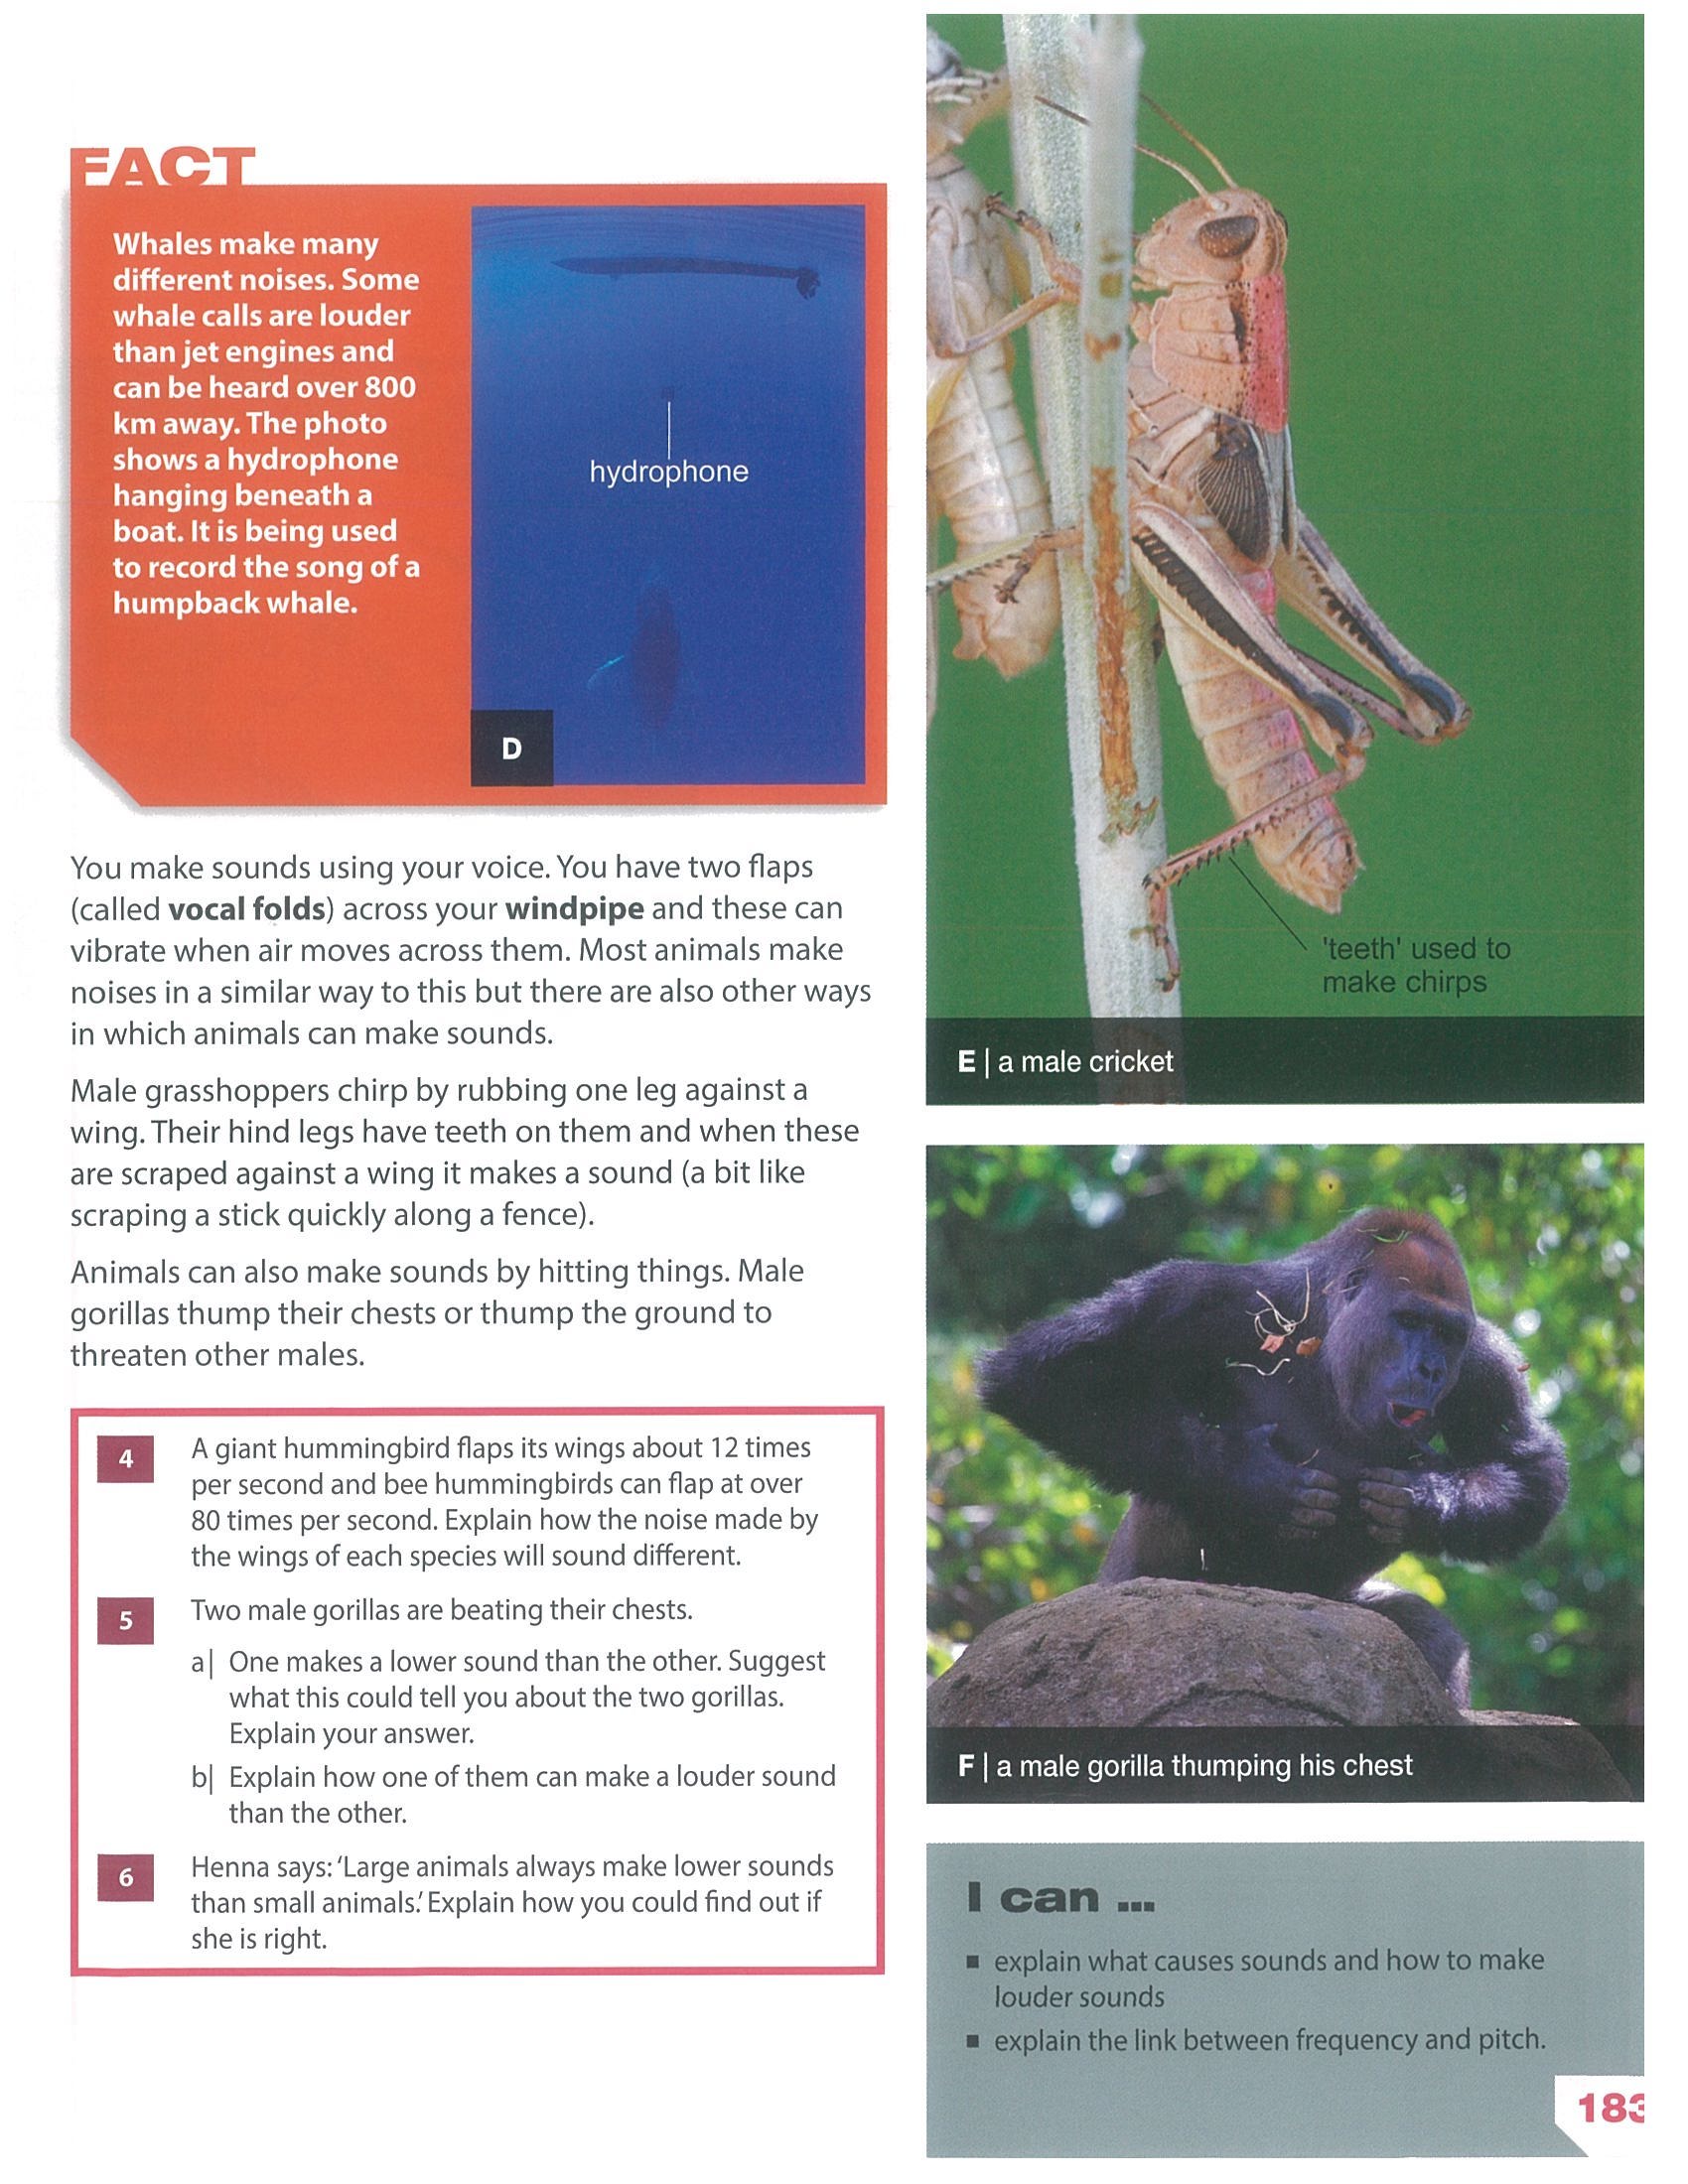
📄 教材 p.183 · Animal Sounds and Frequency
FACT
FACT 框
Whales make many different noises.
鲸会发出许多不同声音。
Some whale calls are louder than jet engines and can be heard over 800 km away.
有些鲸叫声比喷气式发动机还响,可以在 800 多千米外被听到。
The photo shows a hydrophone hanging beneath a boat.
这张照片显示了一个悬挂在船下方的水听器。
It is being used to record the song of a humpback whale.
它正被用来记录座头鲸的歌声。
You make sounds using your voice.
你用嗓音发出声音。
You have two flaps, called vocal folds, across your windpipe and these can vibrate when air moves across them.
你的气管上有两片叫作声带的结构,当空气流过它们时,它们会振动。
Most animals make noises in a similar way to this but there are also other ways in which animals can make sounds.
大多数动物以类似方式发声,但动物也有其他发声方式。
Male grasshoppers chirp by rubbing one leg against a wing.
雄性蚱蜢通过把一条腿和翅膀摩擦来鸣叫。
Their hind legs have teeth on them and when these are scraped against a wing it makes a sound.
它们的后腿上有齿状结构,当这些结构刮擦翅膀时会发出声音。
This is a bit like scraping a stick quickly along a fence.
这有点像快速用棍子刮过栅栏。
Animals can also make sounds by hitting things.
动物也可以通过敲击物体来发声。
Male gorillas thump their chests or thump the ground to threaten other males.
雄性大猩猩会拍打胸部或敲击地面,来威胁其他雄性。
A male cricket.
一只雄性蟋蟀。
Teeth used to make chirps.
用来发出鸣叫声的齿状结构。
A male gorilla thumping his chest.
一只正在拍打胸部的雄性大猩猩。
A giant hummingbird flaps its wings about 12 times per second and bee hummingbirds can flap at over 80 times per second.
巨蜂鸟每秒大约拍动翅膀 12 次,而吸蜜蜂鸟每秒可拍动超过 80 次。
Explain how the noise made by the wings of each species will sound different.
解释这两种蜂鸟翅膀发出的声音会有什么不同。
Two male gorillas are beating their chests.
两只雄性大猩猩正在拍打胸部。
One makes a lower sound than the other.
其中一只发出的声音比另一只更低。
Suggest what this could tell you about the two gorillas.
推测这可能告诉你关于这两只大猩猩的什么信息。
Explain your answer.
解释你的答案。
Explain how one of them can make a louder sound than the other.
解释其中一只如何能发出比另一只更响的声音。
Henna says: "Large animals always make lower sounds than small animals."
Henna 说:“大型动物总是比小型动物发出更低的声音。”
Explain how you could find out if she is right.
解释你如何查明她是否正确。
I can…
我能……
I can explain what causes sounds and how to make louder sounds.
我能解释声音由什么产生,以及如何制造更响的声音。
I can explain the link between frequency and pitch.
我能解释频率和音高之间的联系。
💡 本节核心词汇 · 词源 + 教材原句 + 易错点。
🔊 声音 + 振动核心词
sound
/saʊnd/
n./v.
声音;发出声音
词源拉丁 sonus = "声响";同根:sonic(音速的)、resonate(共鸣)
教材"Sounds are all around us."(声音在我们周围无处不在)
延伸① make a sound 发出声响 ② sound wave 声波 ③ sound effect 音效
vibration
/vaɪˈbreɪʃn/
n.
振动
词源拉丁 vibrare(颤动)+ -tion(名词后缀)= "颤动的过程"
教材"Sounds are made by something vibrating, moving backwards and forwards."(声音是由某物振动产生的)
延伸动词 vibrate 振动;形容词 vibrant 振动的、生气勃勃的
vibration ≠ motion:vibration 是"来回"的反复运动;普通 motion 可以是单向运动。声音必须来自 vibration。
wave
/weɪv/
n.
波;波形
词源古英语 wafian = "挥手、起伏"
教材"sound wave"(声波)
延伸① light wave 光波 ② water wave 水波 ③ wavelength 波长
frequency
/ˈfriːkwənsi/
n.
频率
词源拉丁 frequens(频繁的)+ -cy(名词后缀)= "频繁的程度"
教材"the link between frequency and pitch"(频率与音高的联系)
延伸单位 hertz (Hz) 赫兹;高频 = high frequency = 高音 pitch
frequency ≠ amplitude:frequency = 每秒振动次数(决定音高);amplitude = 振动幅度(决定响度)。两个完全不同的物理量,考试常考!
pitch
/pɪtʃ/
n.
音高(高音/低音)
词源古英语 picchen = "投掷、定位";这里指音"定在多高的位置"
教材"how to make high notes and low notes on a guitar"(吉他高低音)→ 高低 = pitch
延伸① high pitch 高音 ② low pitch 低音 ③ 对应 frequency:高频 → 高音
pitch ≠ loudness:pitch 是"音的高低"(如老鼠声音 vs 大象声音);loudness 是"音的响轻"(如蚊子嗡嗡 vs 雷声)。中学经常混!
loud
/laʊd/
adj.
响的、大声的
词源古英语 hlūd = "大声的";同根:listen(倾听)
教材"how to make louder sounds"(如何制造更响的声音)
延伸名词 loudness 响度(= 听到的强弱);对应 amplitude:大振幅 → 大响度